Placeholder For the Unreleased SHRINE 3.1!
You Are Very Likely Reading the Wrong Document!
Tour of the Web Client
Introduction
The functionality described in the user guide assumes that you have received the necessary prior authorizations to access a SHRINE network at your institution. The process for this authorization varies according to your institution and network.
Most SHRINE networks use a tool called the Data Steward Application to request and approve query topics prior to use of the SHRINE Web Client. Your local administrator or network contact will provide information about this prerequisite step, if applicable.
Details of shots presented in this document may vary from network to network. Each network uses a different ontology and may be uniquely configured. We have attempted to note in this document where these situations may be expected. If you have questions, please contact your local network representative.
The SHRINE Webclient Contains 2 main views:
I. The Find Patients View
II. View Patient Counts
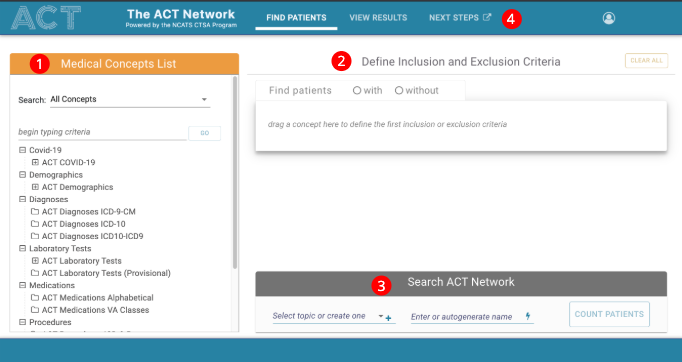
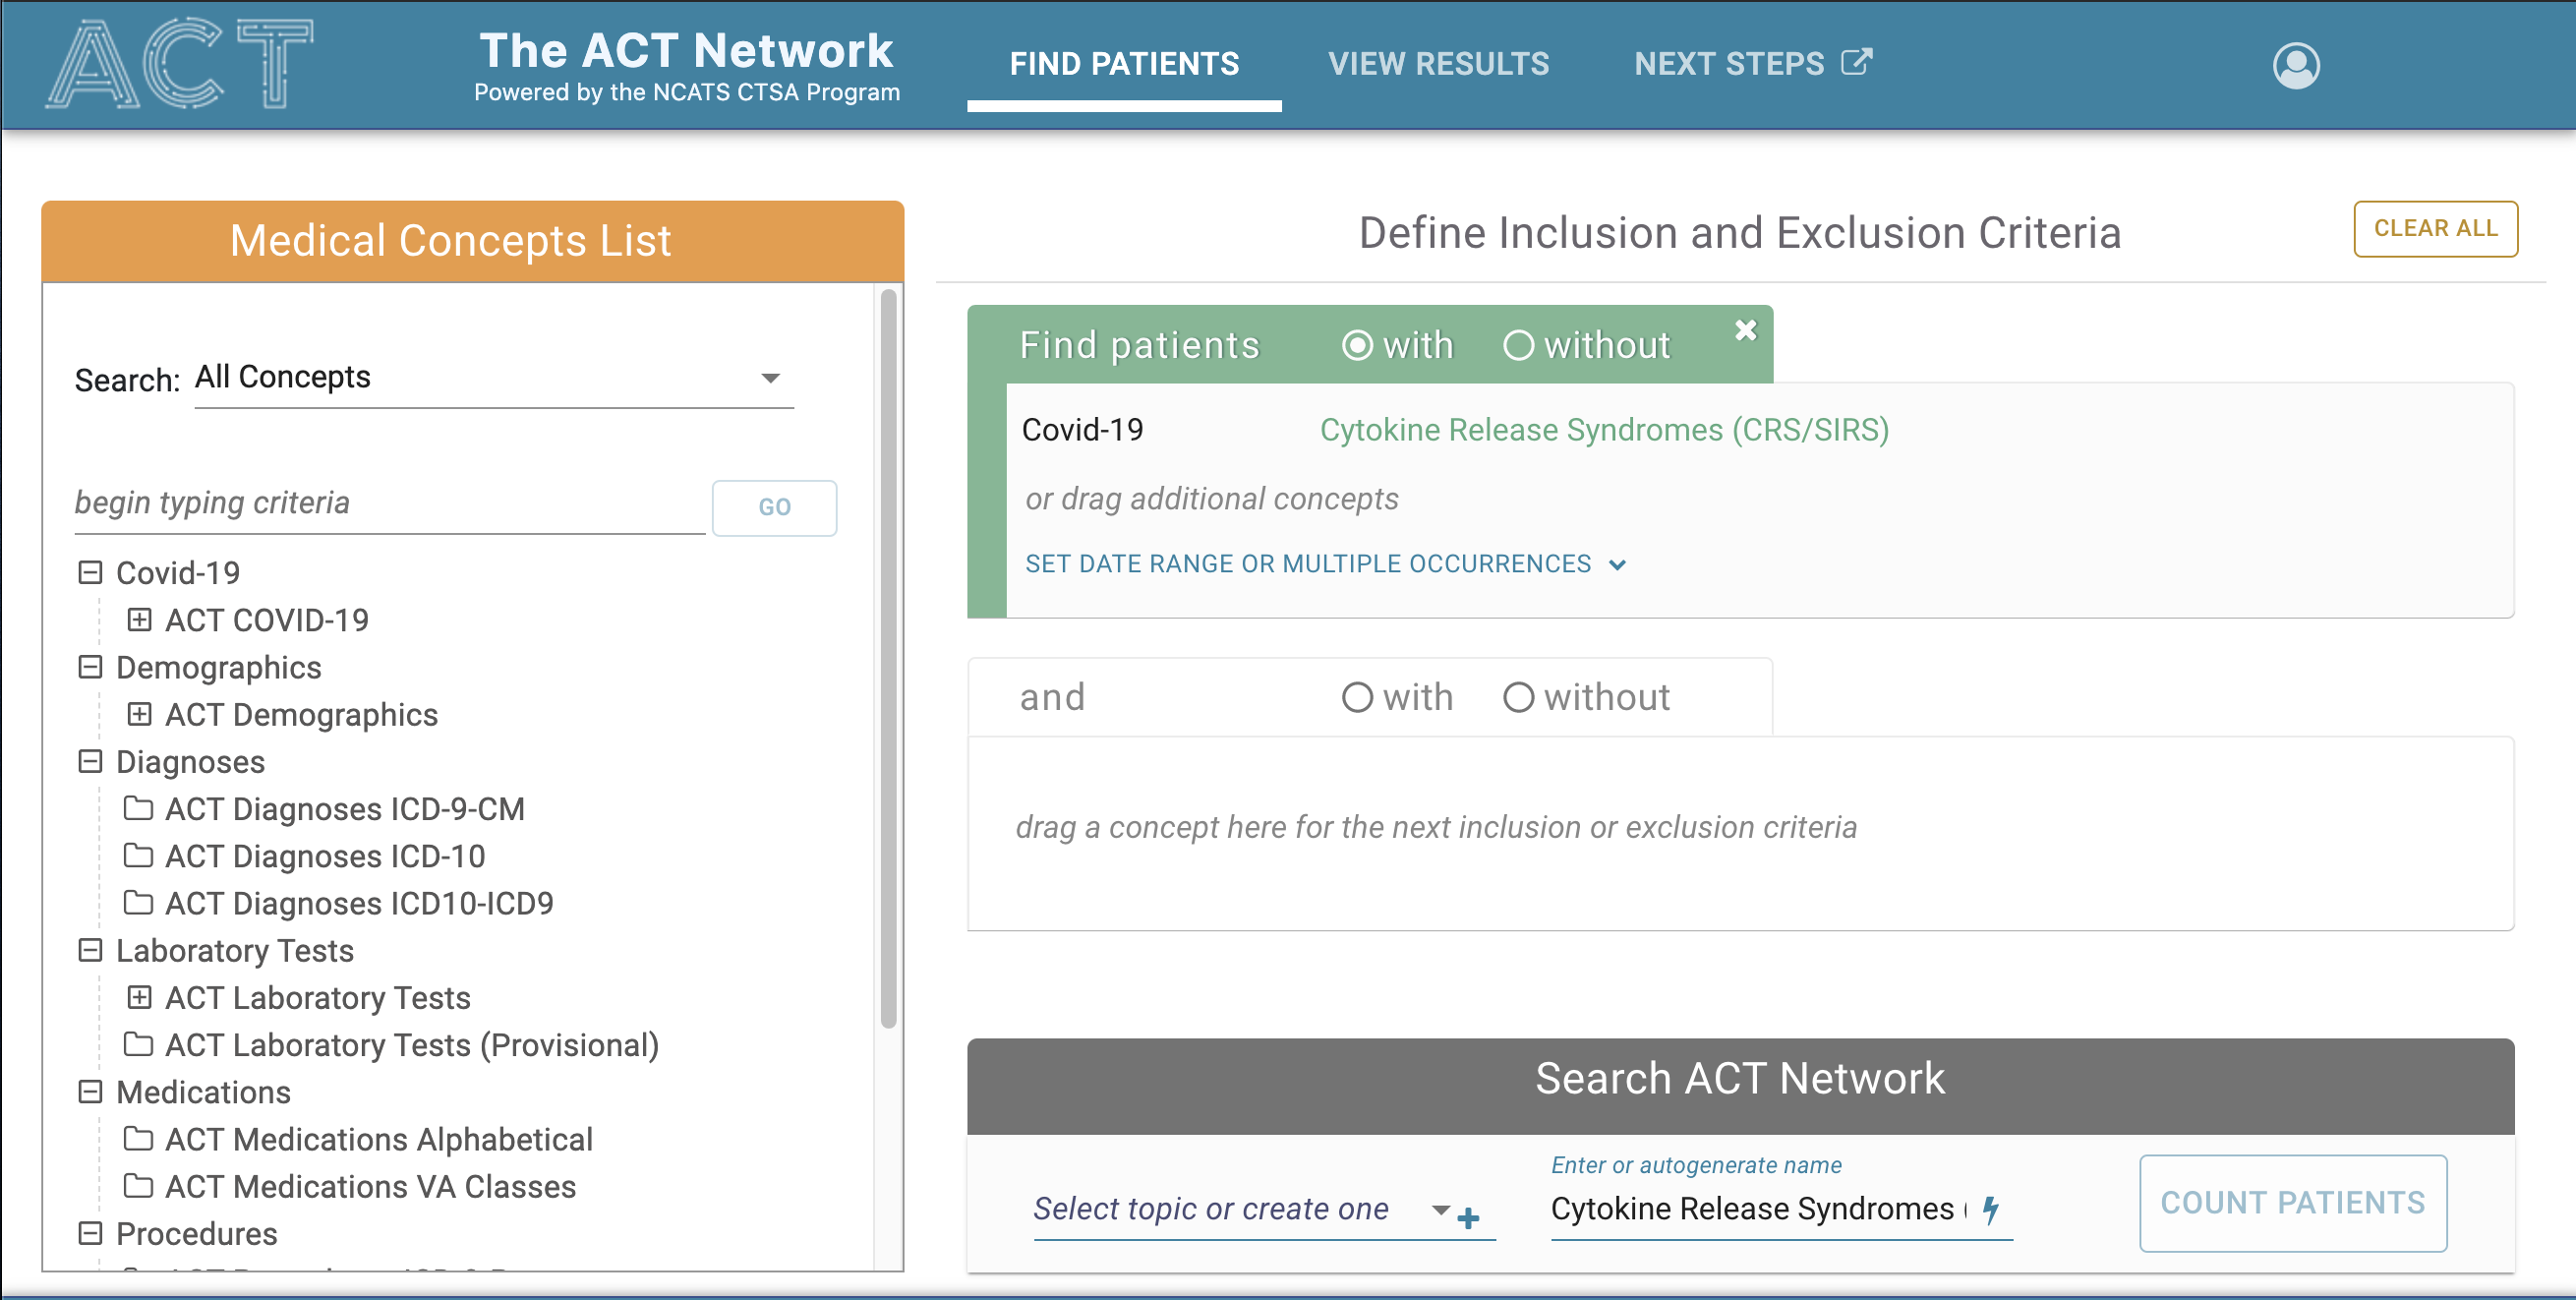
I. The Find Patients View
The default view the user will see upon logging in is the Find Patients view.
The Find Patients view is divided into 3 modules: 1 Medical Concepts, 2 Inclusion and Exclusion Criteria, 3 Start Query.
The main menu is in the upper middle 4.
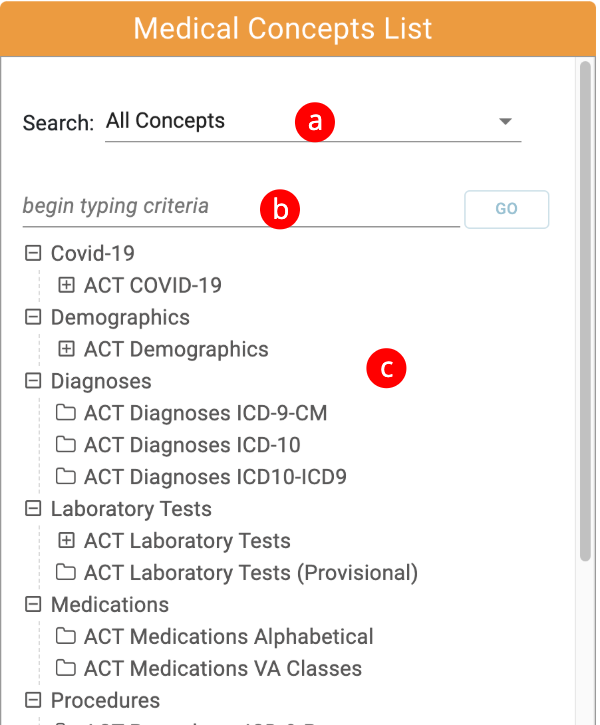
1. Medical Concepts Module
The Medical Concepts panel consists of:
a - The Filter Drop Down menu.
b - The Search Field
c - The Medical Concepts Tree
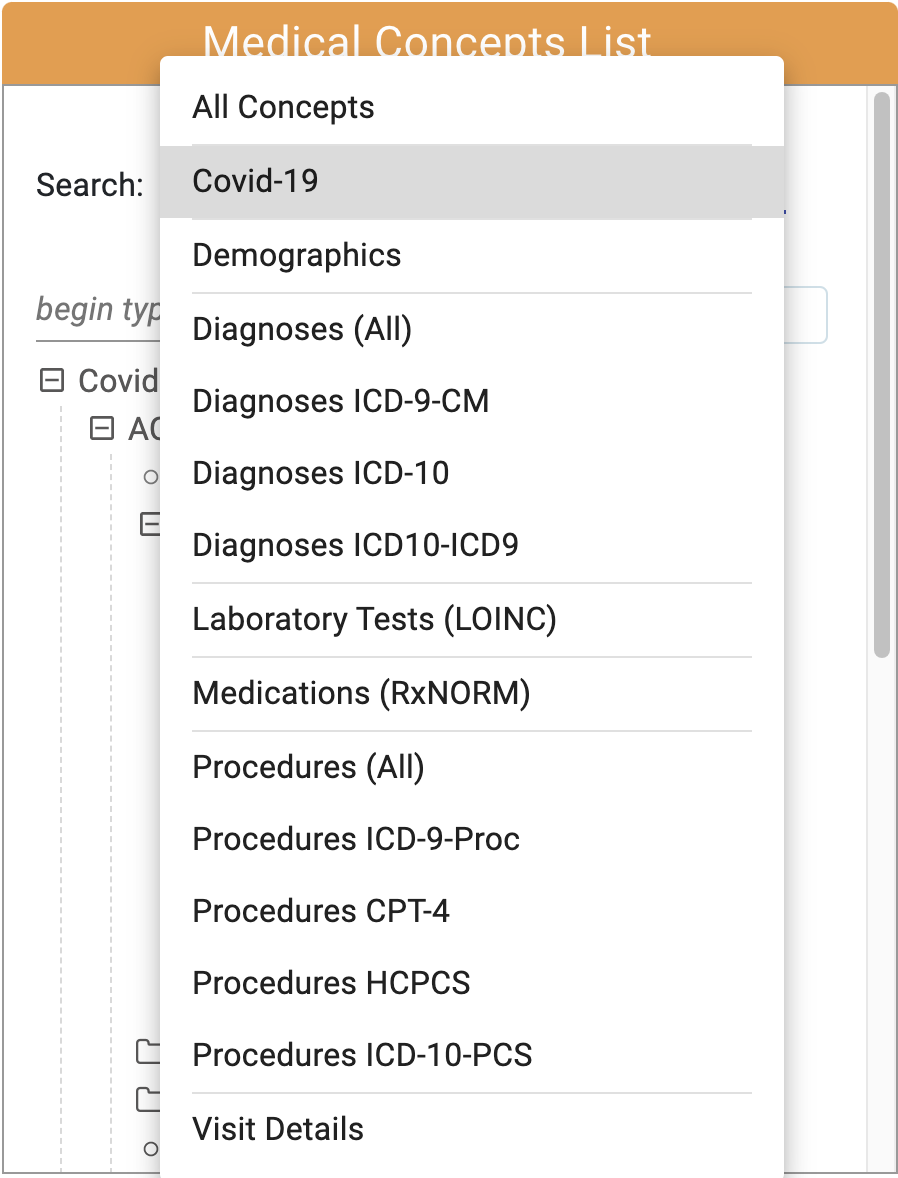
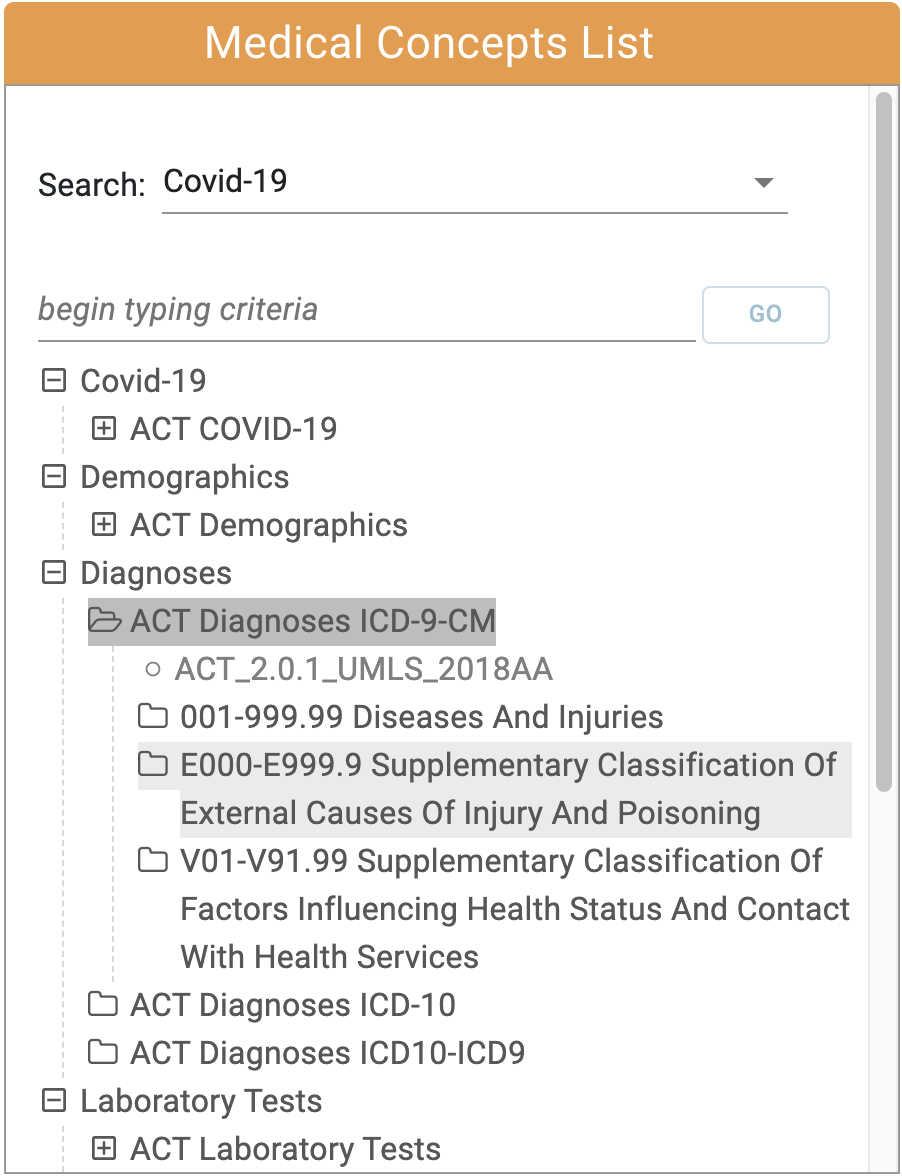
a - The Filter Drop Down menu.
The Code Category Filter is used in combination with the search field to filter the concepts by category.
The filter will be applied to any searches performed by typing a search term in the Search Field and hitting the go button (see part b).
b - The Search Field
As the user types in the search field, matches will automatically appear in a dropdown below after 3 characters or more have been typed.
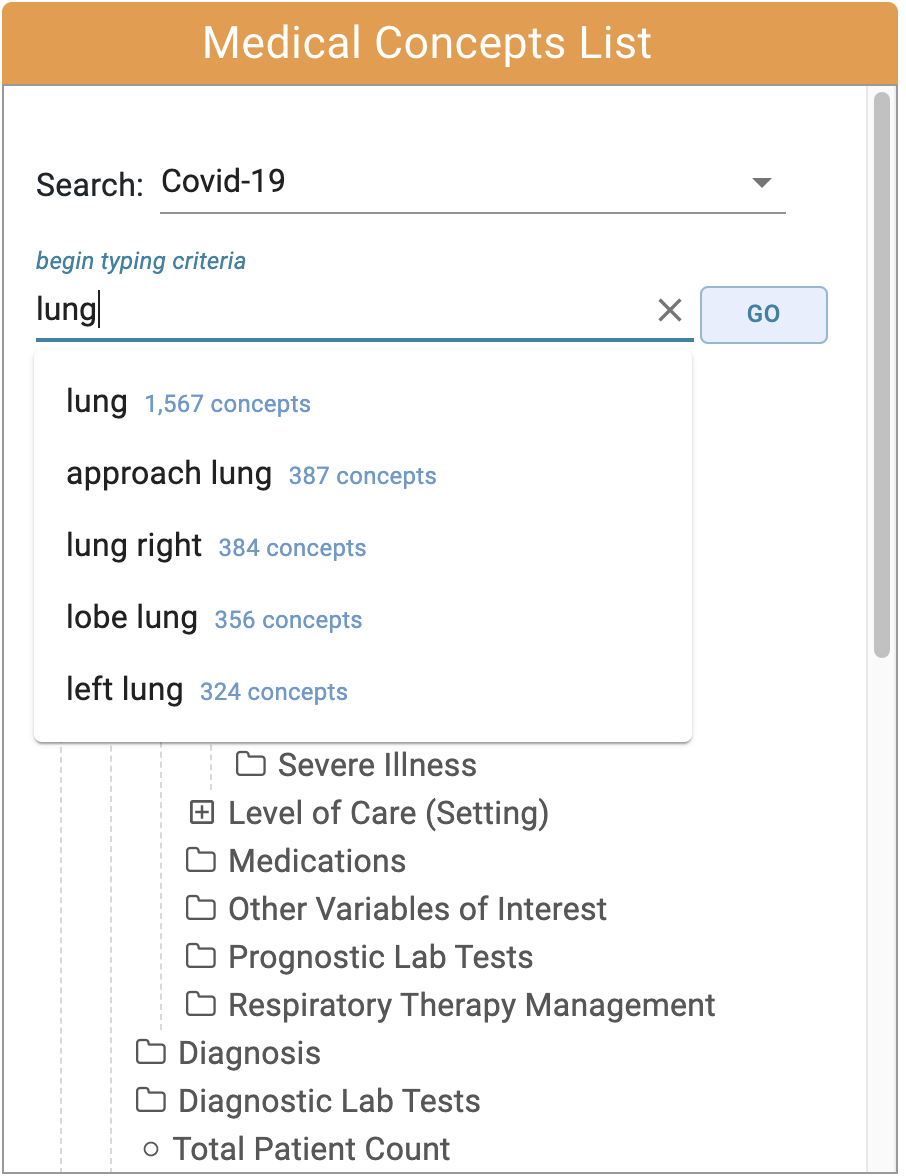
If the user selects a matching term and clicks the go button on the right, the filtered concept tree will appear.
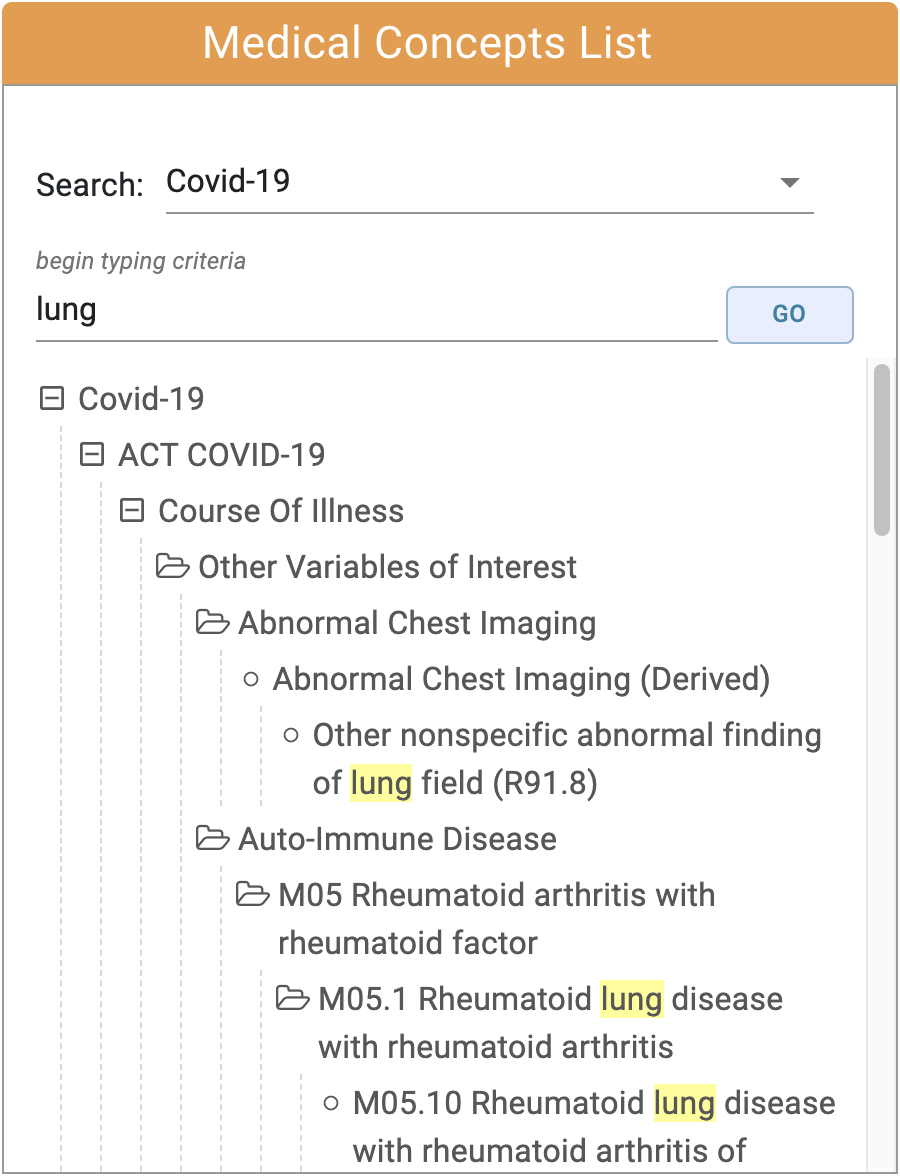
The user can also navigate the Concept Tree by expanding the folders to view the child concepts.
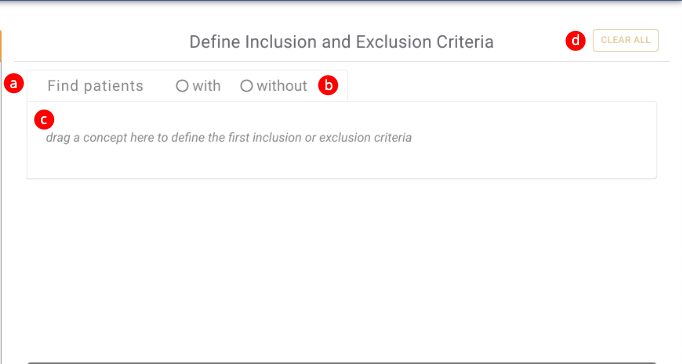
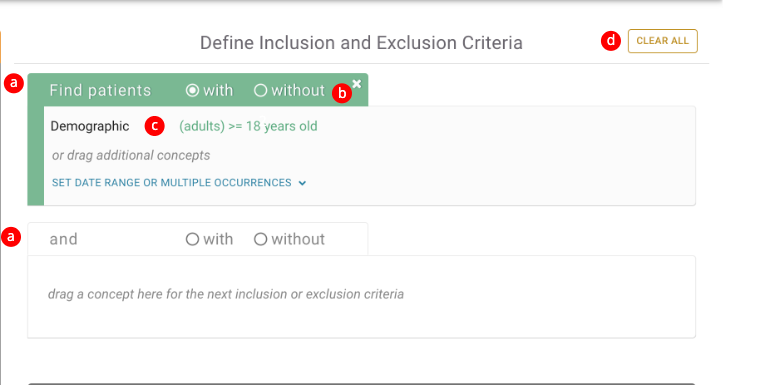
2. Inclusion and Exclusion Criteria Module
The inclusion and Exclusion Module Consists of one or more Medical Concept Group (a) consisting of:
b - With or Without Toggle
c - Concept Drop Area
d - Clear All button
Concepts can be dragged from the medical concept list and dropped into the Concept Drop Area of a Medical Concept Group.
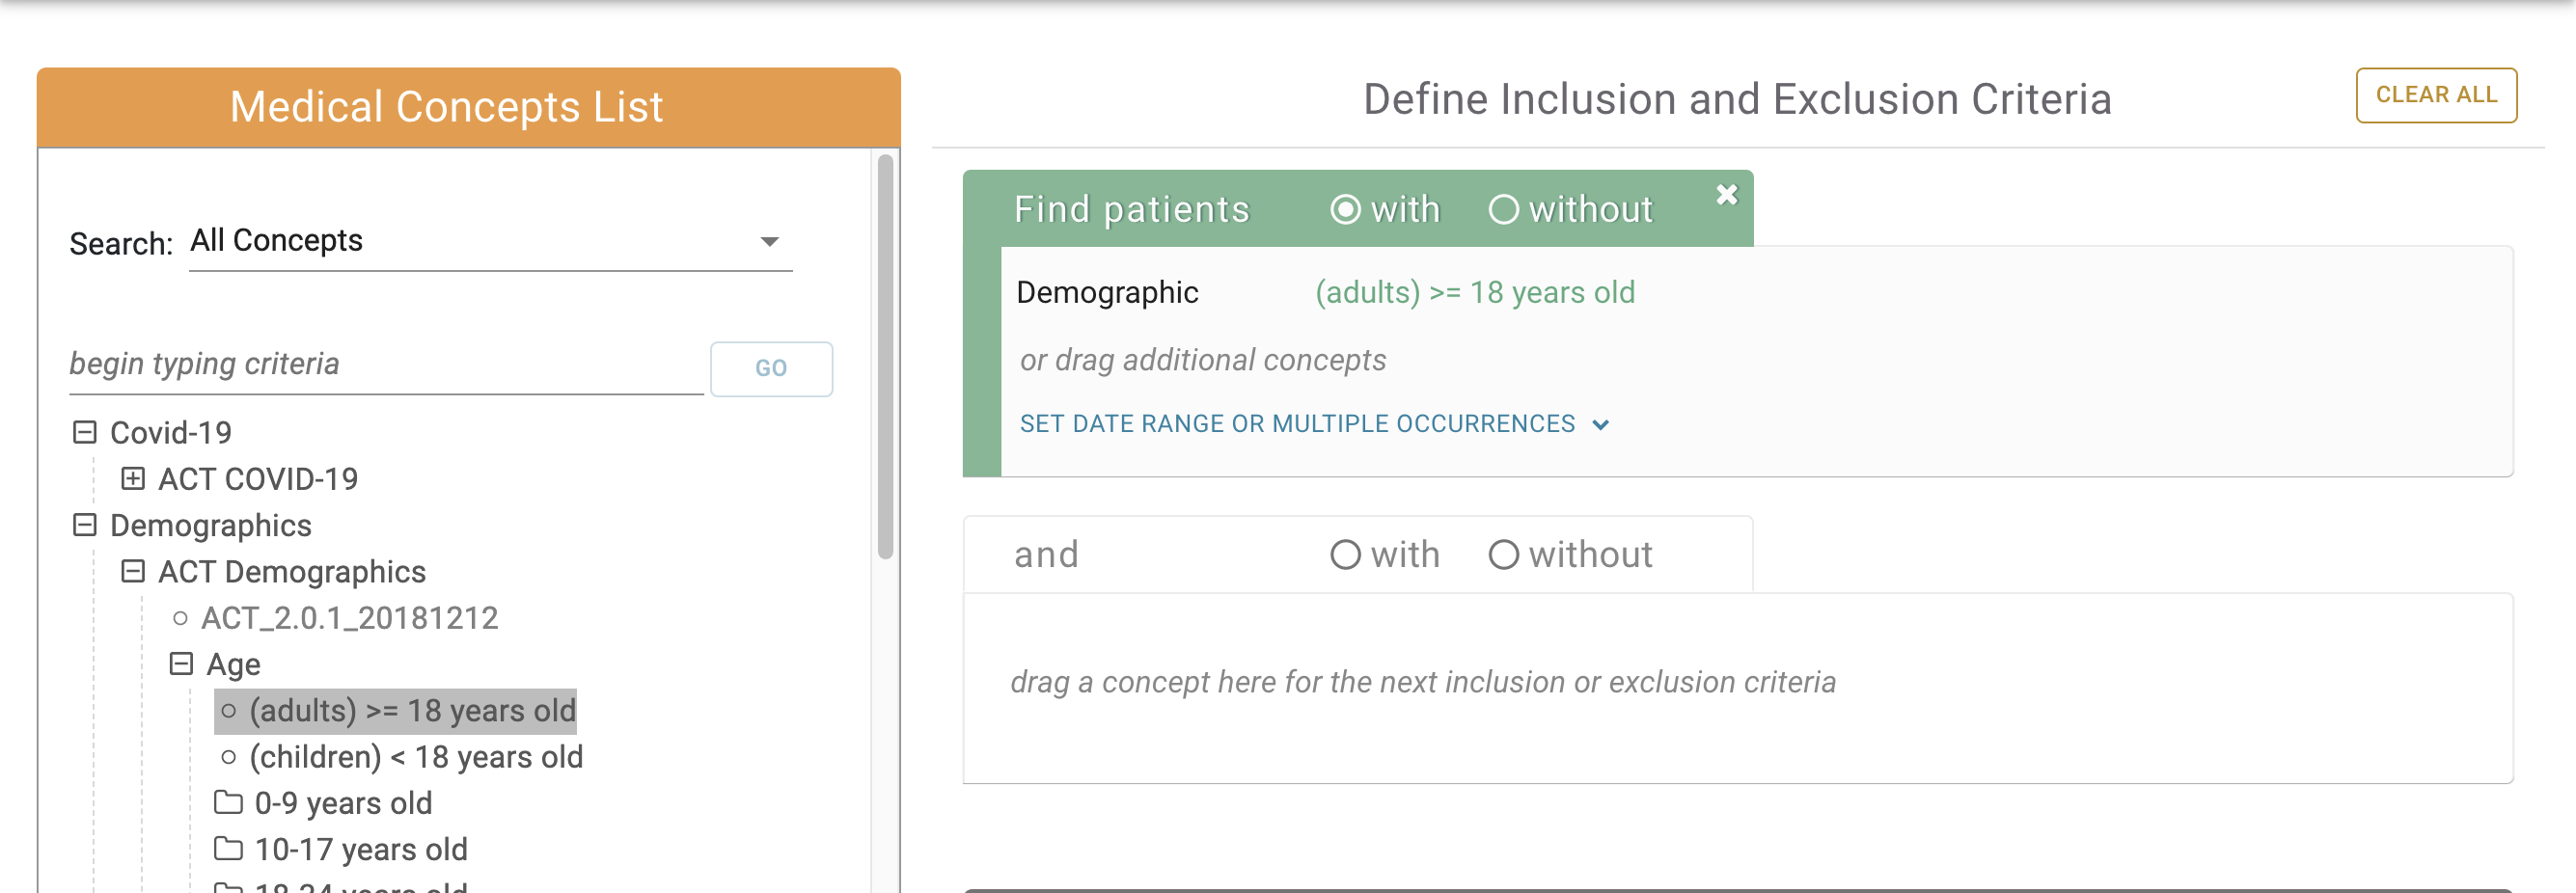
When a concept is dropped into a Medical Concept Group, some things to note are:
a. The Medical Concept Group that the concept was dropped into becomes active.
a. A new inactive Medical Concept Group is automatically added below the original.
b. The With or Without Toggle is set to "with" by default but can now be toggled to "without".
c. The new concept now appears in the Concept Drop Area and can be removed by mousing over the concept and clicking the x that appears.
d. The entire query can be reset by clicking the Clear All button.
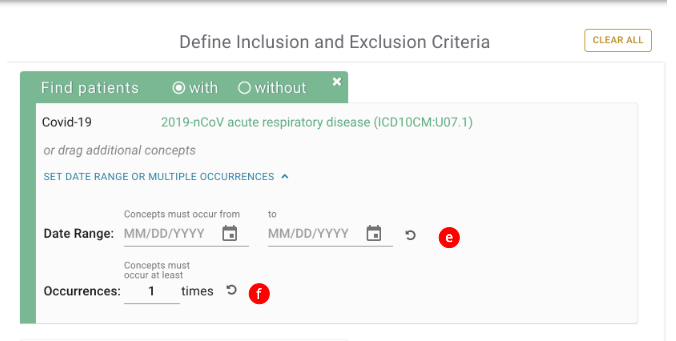
Setting the Date Range or Multiple Occurrences.
Using a different query containing a diagnosis of Covid-19 related Acute Respiratory Disease, we can demonstrate the ability to set the date range (e) and change the number of occurrences of the diagnosis (f). Please note that the date settings can contain either a start date or an end date or both.
3. Start Query Module
The Start Query Module Consists of:
a - The Query Topic Selection.
b - Query Name field.
c - The Count Patients Button

A Query Topic must be selected and a Query Name must be entered into the Query Name field before a query can be run.
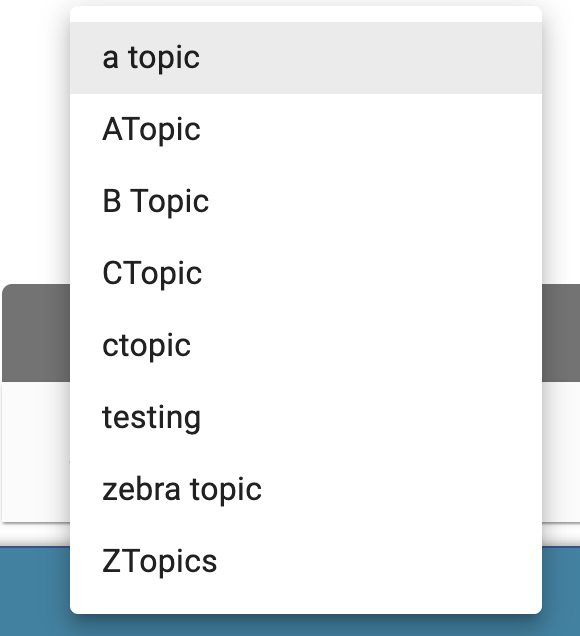
a. Query Topic Selection
A user must select a query topic before running a query.

If no query topics exist, clicking the "+" button to the right of the Query Topic Selection will allow the user to create a topic.
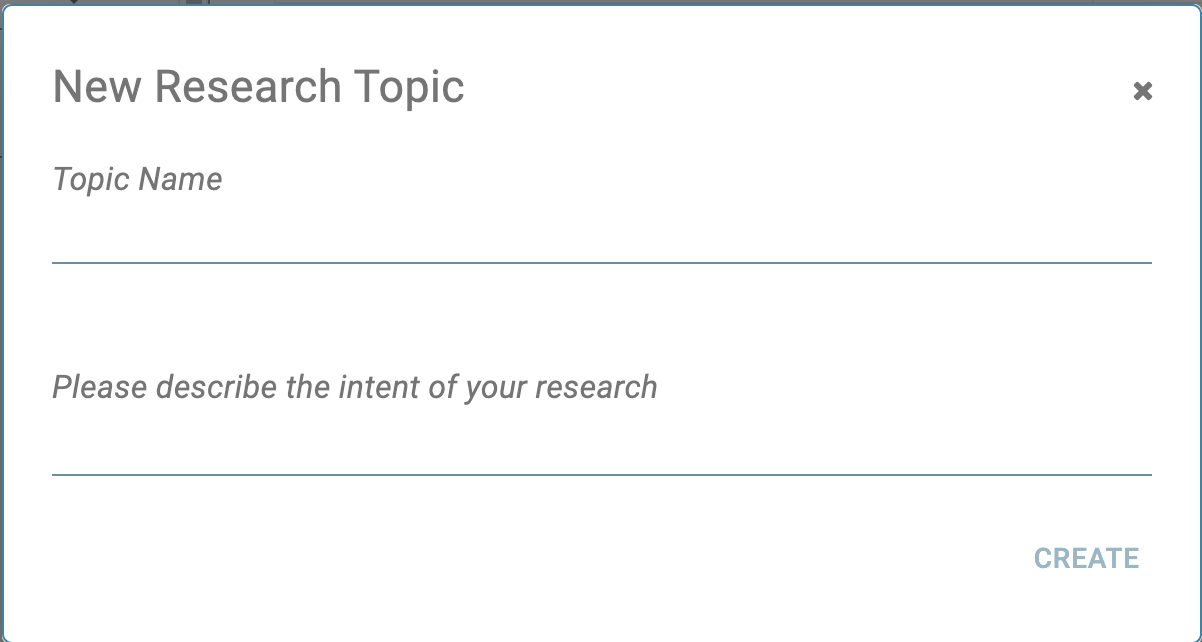
After creating a topic, it will show up in the topic drop down where it can be selected.
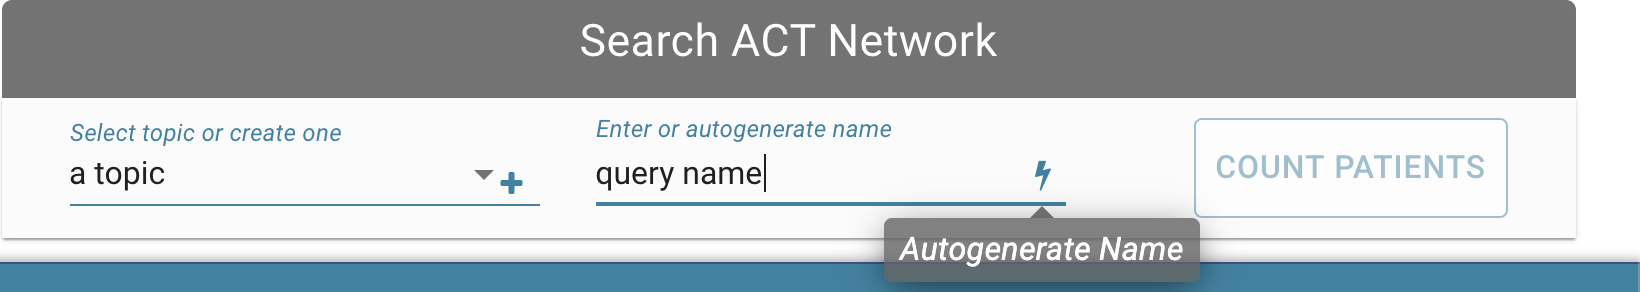
b. Query Name Field
In addition to the Query Topic Selection, the Query Name Field is required before being able to run a query.

A user can autogenerate a query name by clicking the lightning graphic on the right:
b. Count Patients Button
When all required fields are populated on the form, the user can click the Count Patients button to start a query.

The Count Patients button will automatically disable if any required fields are missing.

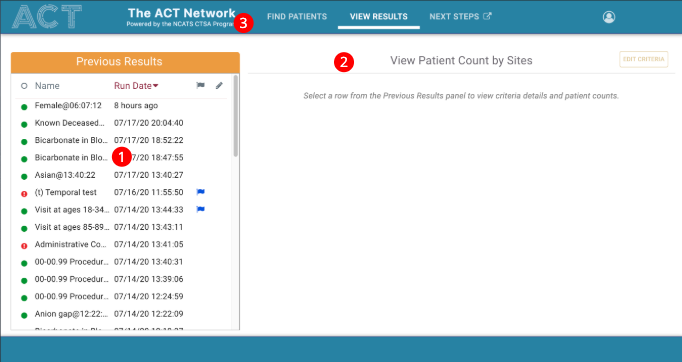
II. View Patient Counts
View Results is divided into 2 modules: 1 Previous Results, 2 Patient Counts. The main menu 3 can be used to switch between the Find Patients and View Results Views.
1. Previous Results Module
The Previous Module Consists of:
a - The Previous Results Header.
b - Previous Results
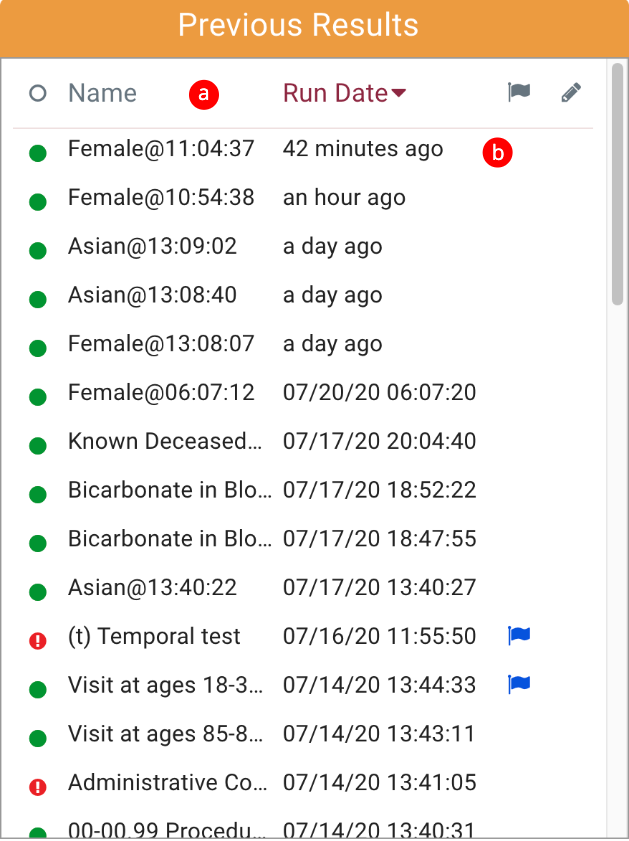
a. The Previous Results Header
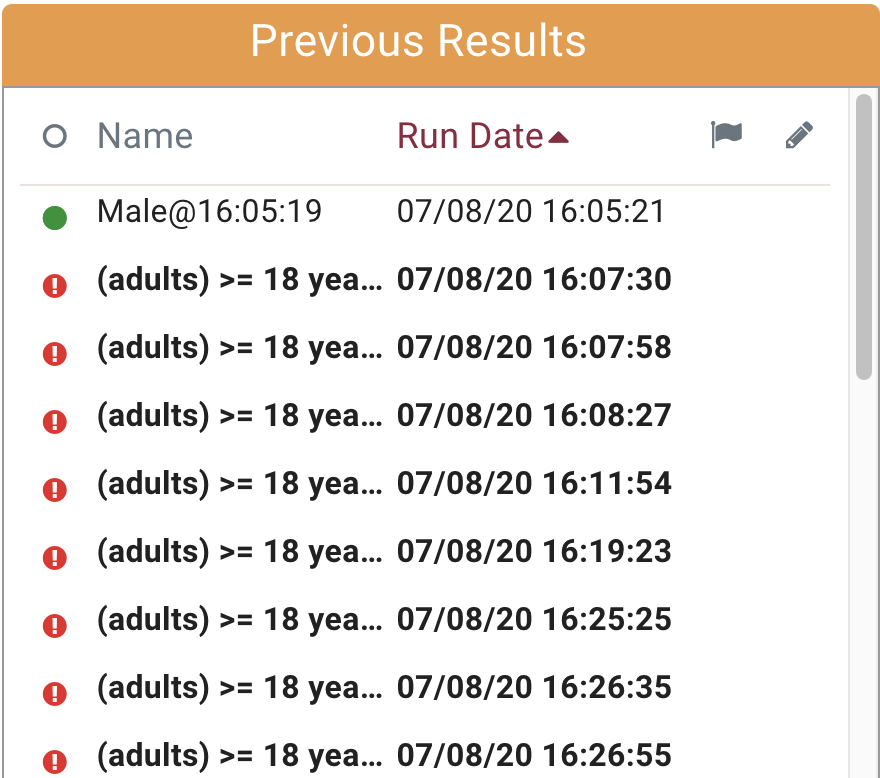
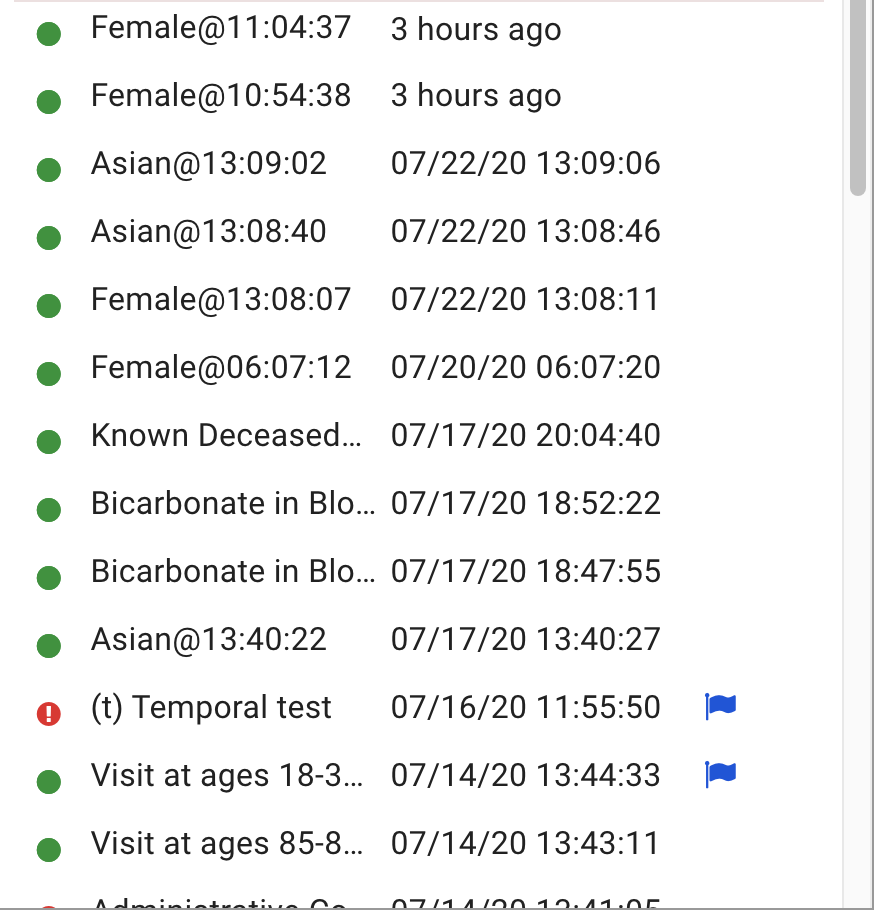
The Previous Results Header provides the ability to sort the Previous Results by Query Name, Run Date and Flag Status. In the example below, the Previous Results are sorted by Run Date with the most recent results sorted at the top of the table:
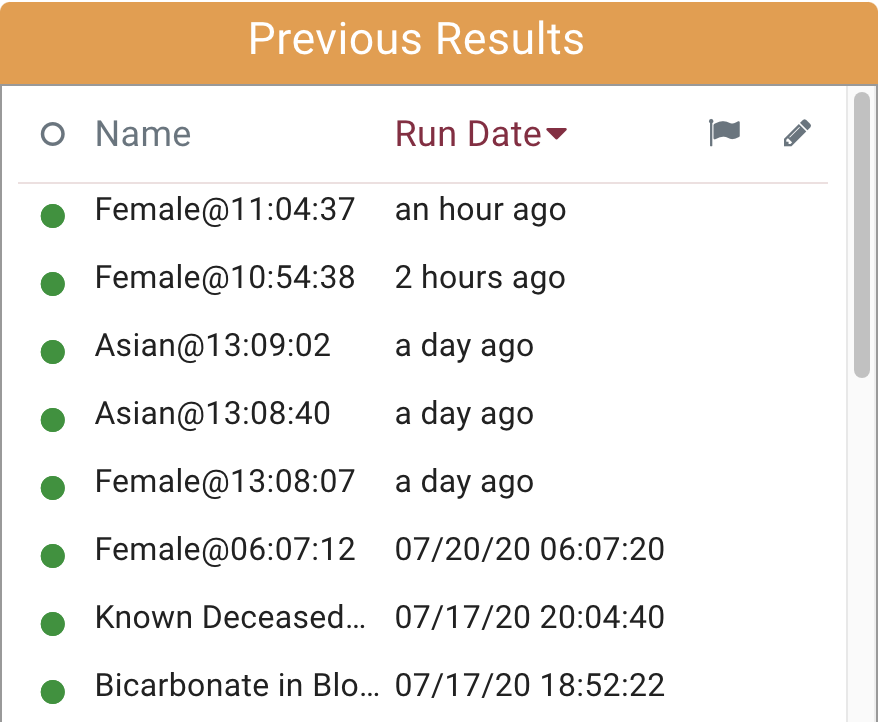
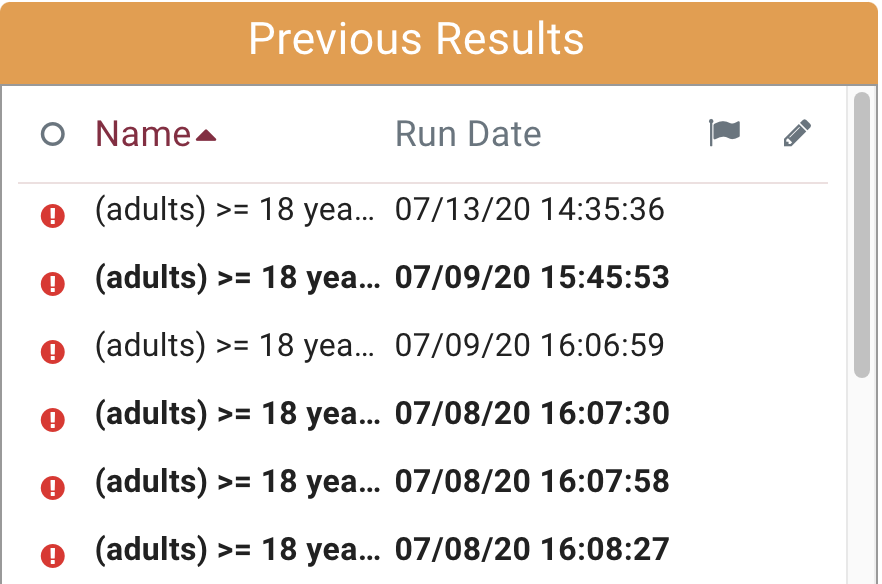
In the following example the Previous Results are sorted by Run Date with the least recent results sorted at the top of the table:
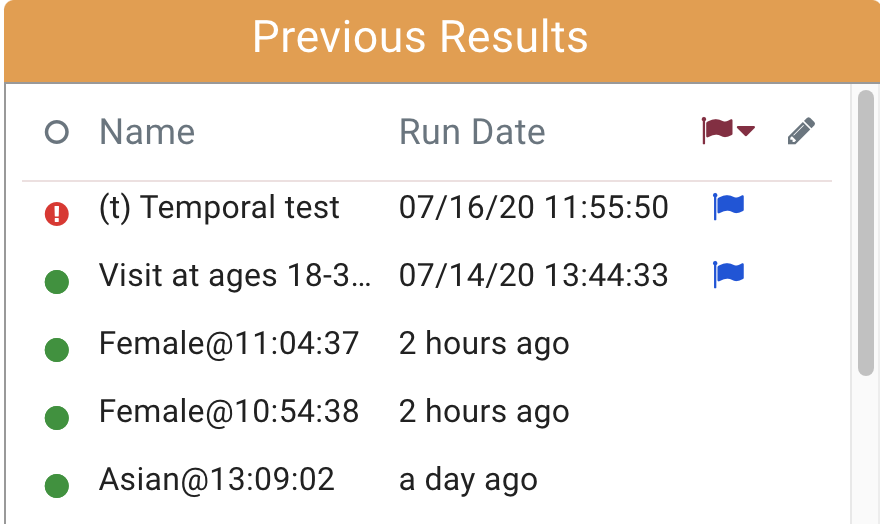
In the following example the results are sorted with flagged queries at the top of the table:
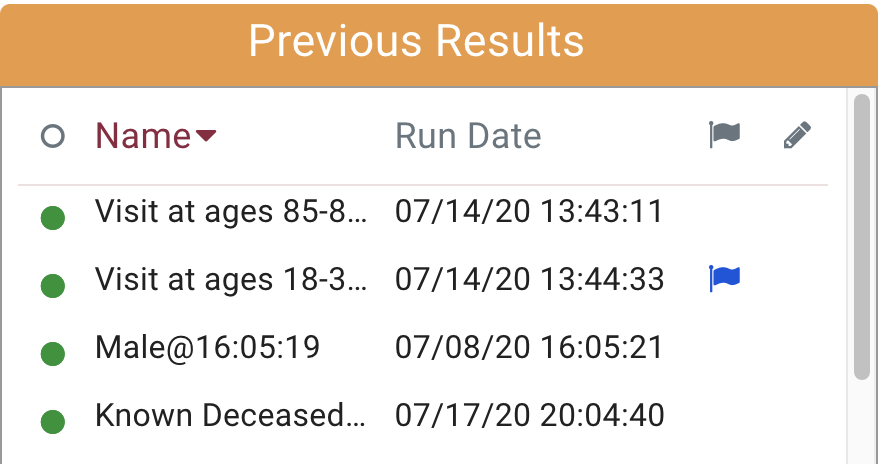
In the following example the results are sorted in alphabetical order:
In the following example the results are sorted in reverse alphabetical order:
b. Previous Results
The previous results are queries that are either currently in progress or have already completed.
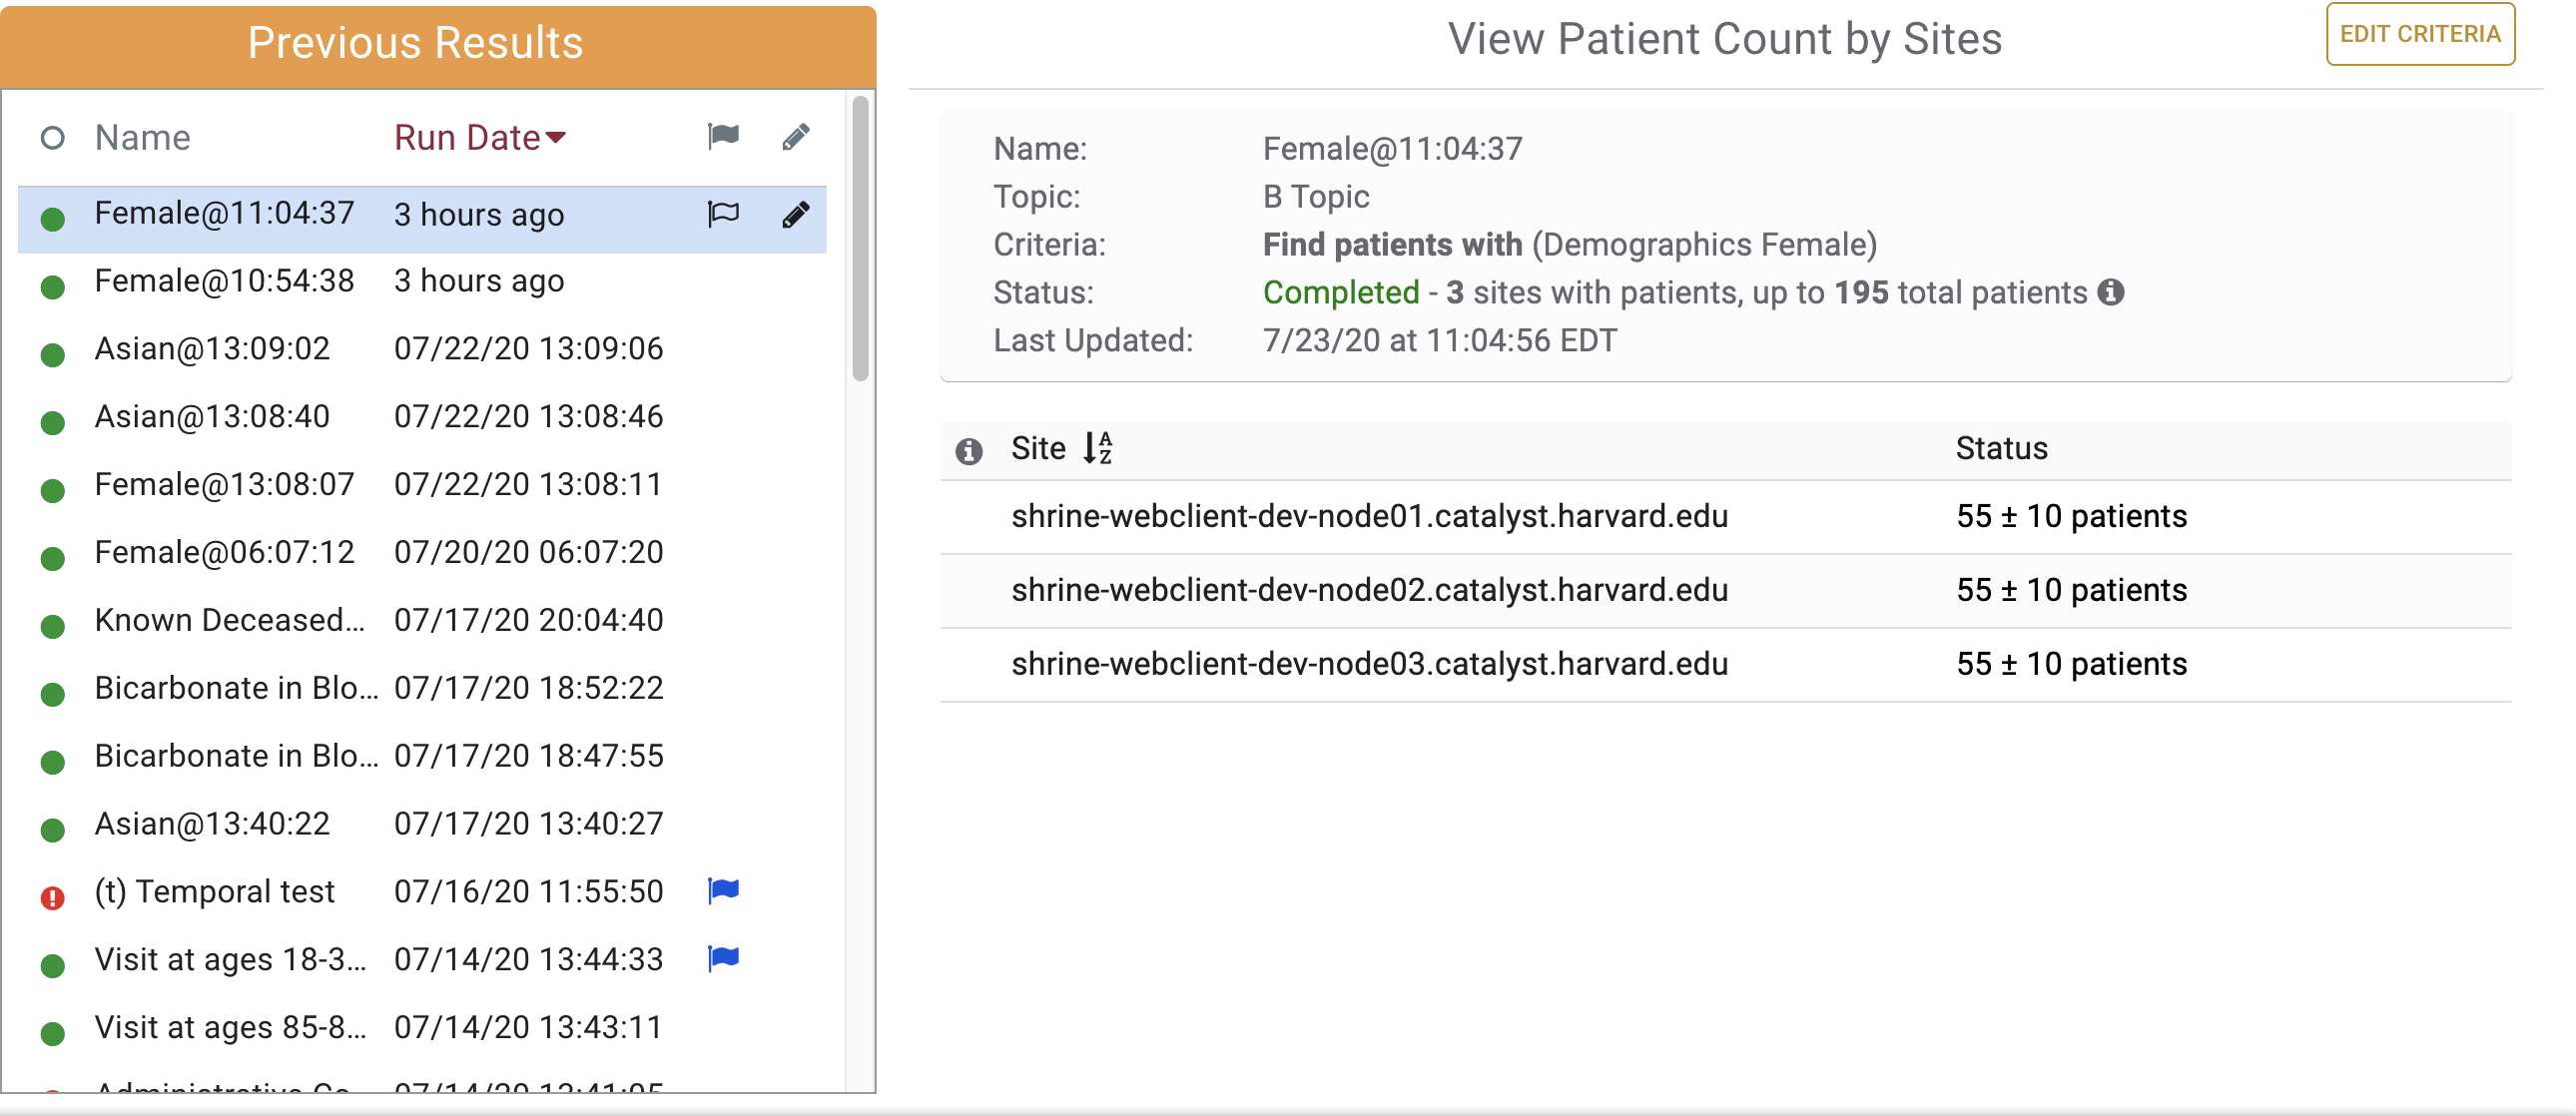
Clicking on one of the queries will retrieve its results as seen below. The right hand section titled View Patient Count By Sites will be described in more detail later on in this tutorial.
Query Status Indicator Column
The dot in the first column indicates the status of the query. Green indicates a successfully completed query and Red indicates a query that had an error retrieving results.

Query Name Column
The second column is the query name:

Execution Time
The third column is the time when the query was run:

Flag Query Button
The fourth column is a button that allows the user to flag a query:

Clicking the button reveals the Flagging dialog shown below:
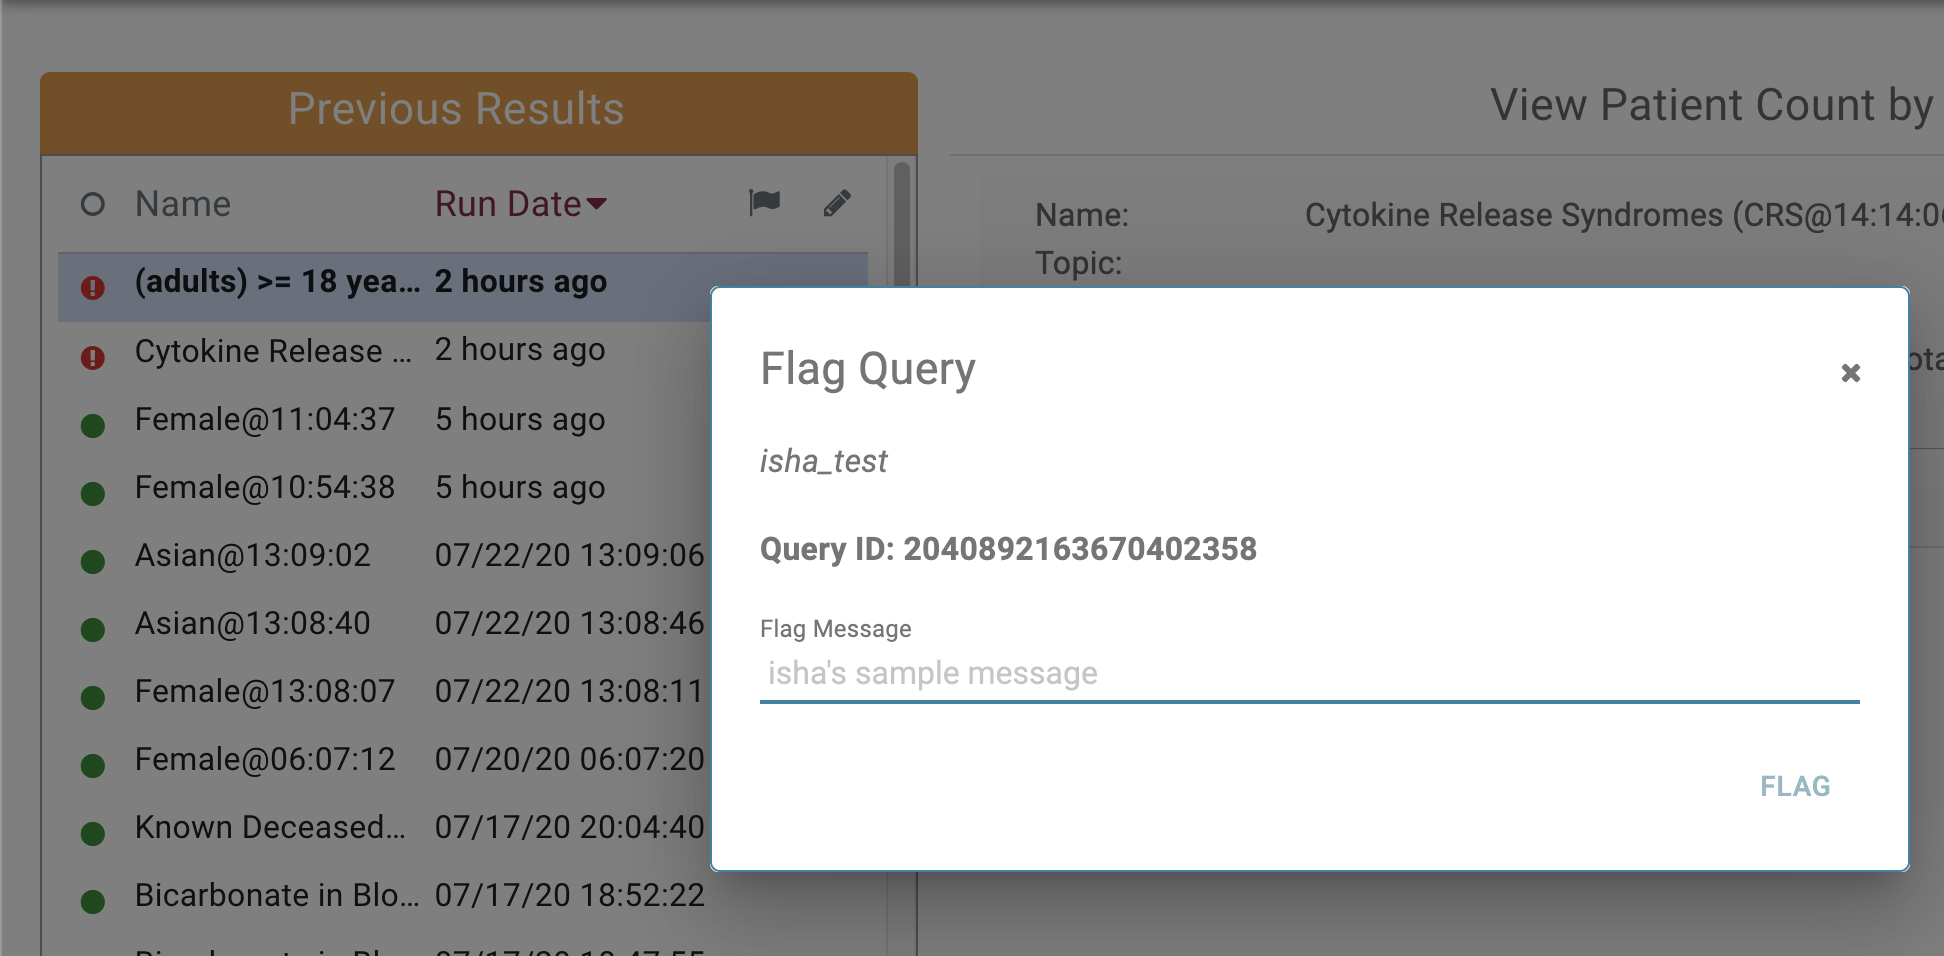
Filling in a flag Message and clicking the flag button will flag the query. A flagged query is indicated by a blue flag icon in the flagging column:

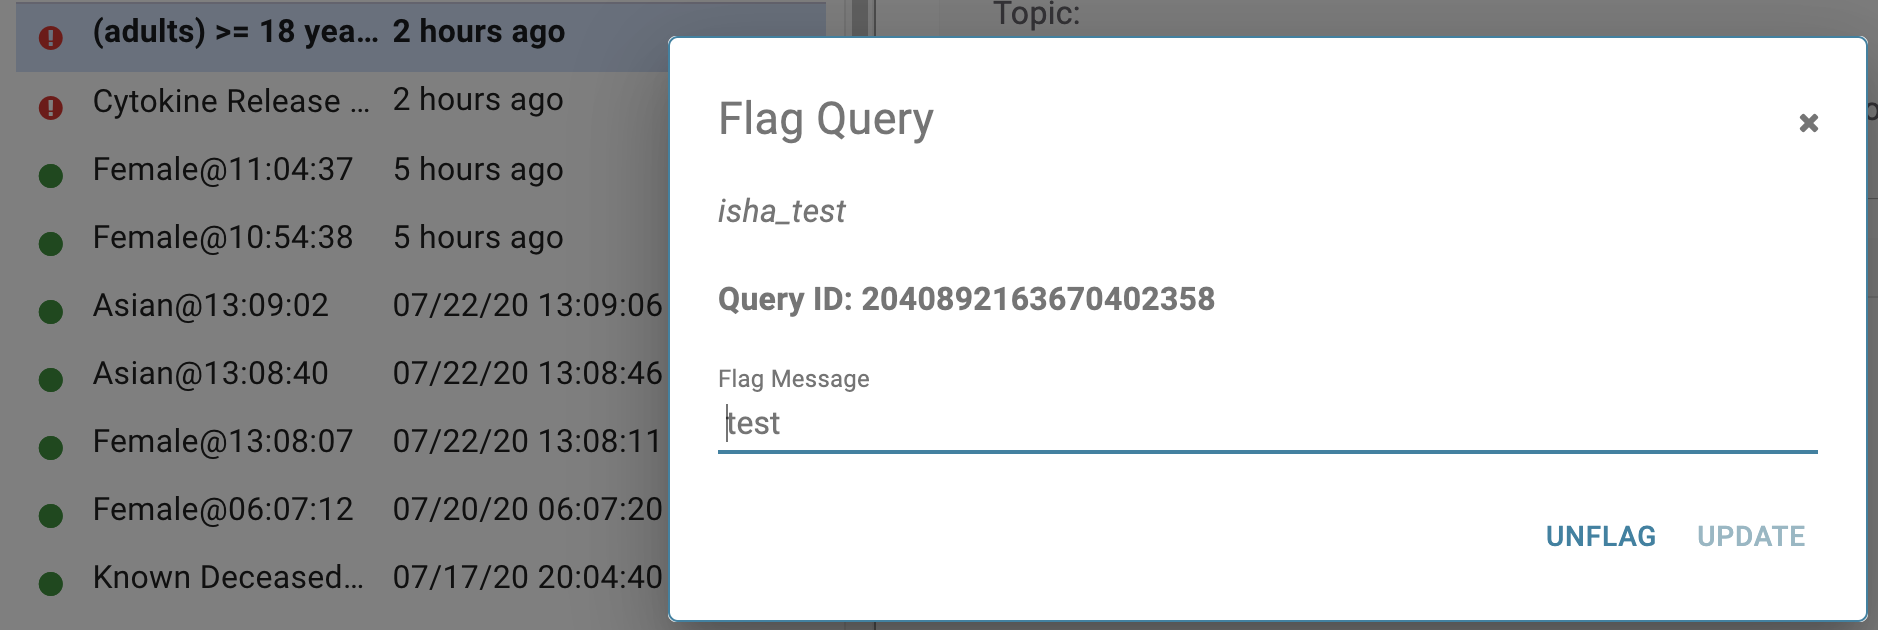
Conversely, the user can unflag the query by clicking the blue flag icon which will launch the unflag dialog. Clicking the unflag button will unflag the query:
Rename Query Button
The fifth column is a button that allows the user to rename a query:

Clicking the rename query button will launch the rename dialog show below:
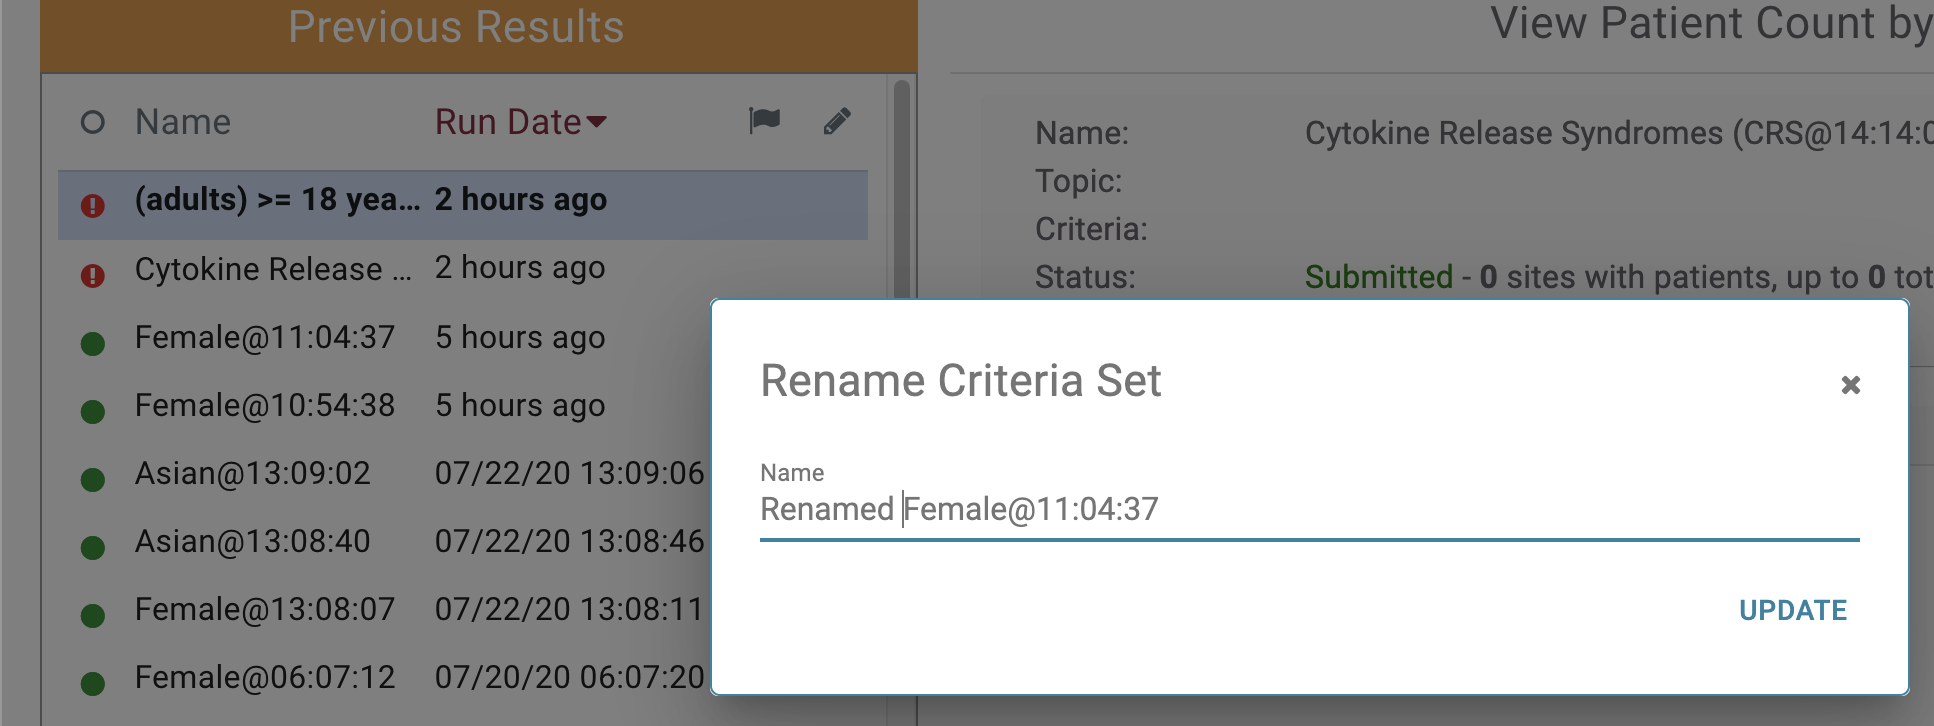
In this example we are changing the name of this query to "Renamed Female@11:04:37" and clicking the update button. The name is now updated in the table row:

2. Patient Counts Module
The Patient Counts Module consists of:
a. Query Metadata
b. Patient Counts
c. Edit Criteria Button.
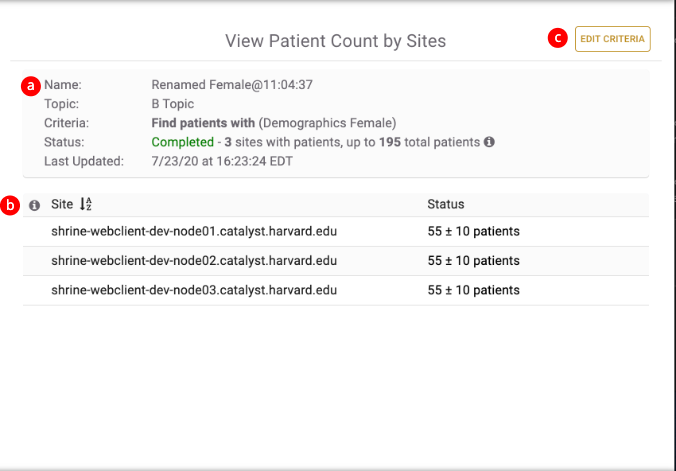
a. Query Metadata
The Query Metadata has the following information rows:
Name - the name of the query.
Topic - the topic that the query is associated with.
Criteria - the query definition
Status - the status of the query...i.e. Completed, Submitted...e.t.c.
Last Updated - a timestamp for the last time the query retrieved updated information.

b. Patient Counts
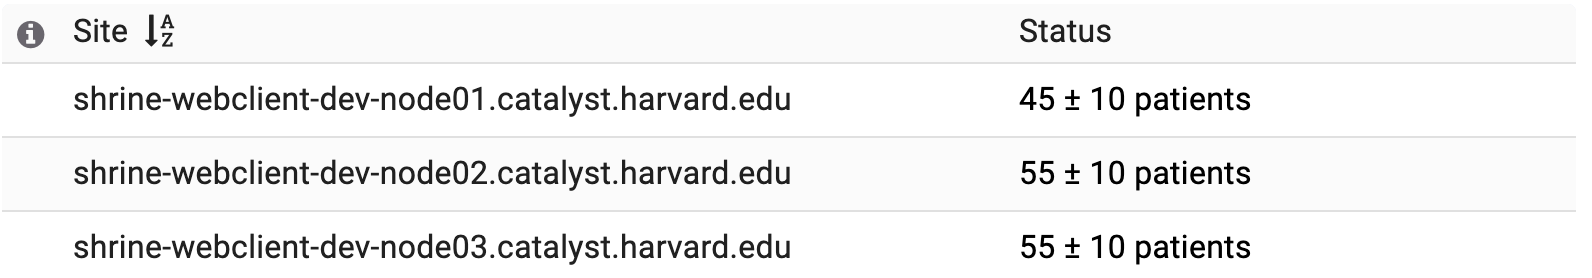
The patient counts table contains rows that display a site name and its associated patient count. In the example below we can see in first row that the site shrine-webclient-dev-node1.catalyst.harvard.edu has a count of 45 patients (plus or minus 10 patients), the site shrine-webclient-dev-node2.catalyst.harvard.edu has a count of 55 patients (plus or minus 10 patients), and the site shrine-webclient-dev-node3.catalyst.harvard.edu has a count of 55 patients (plus or minus 10 patients).
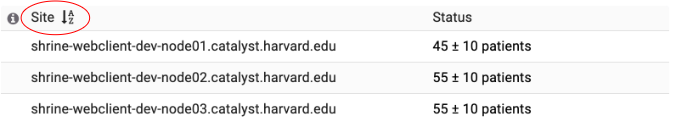
In addition we can sort the results by clicking the Site column header. In the example below, the counts are sorted by site name alphabetically:
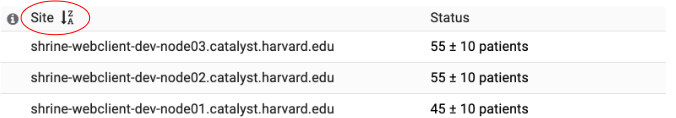
In the example below, the counts are sorted by site name reverse-alphabetically:
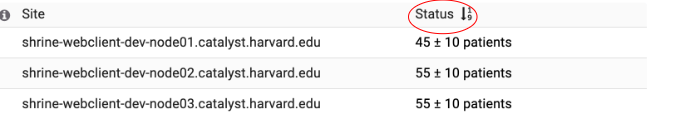
Additionally, we can sort by the status. In the example below the counts are sorted by the number of results ascending with the fewest counts at the top:
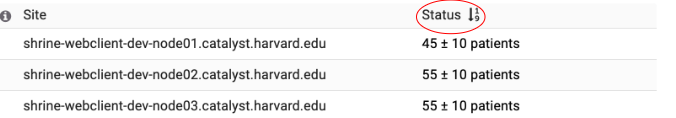
In the example below the counts are sorted by number of results descending with the largest counts at the top:
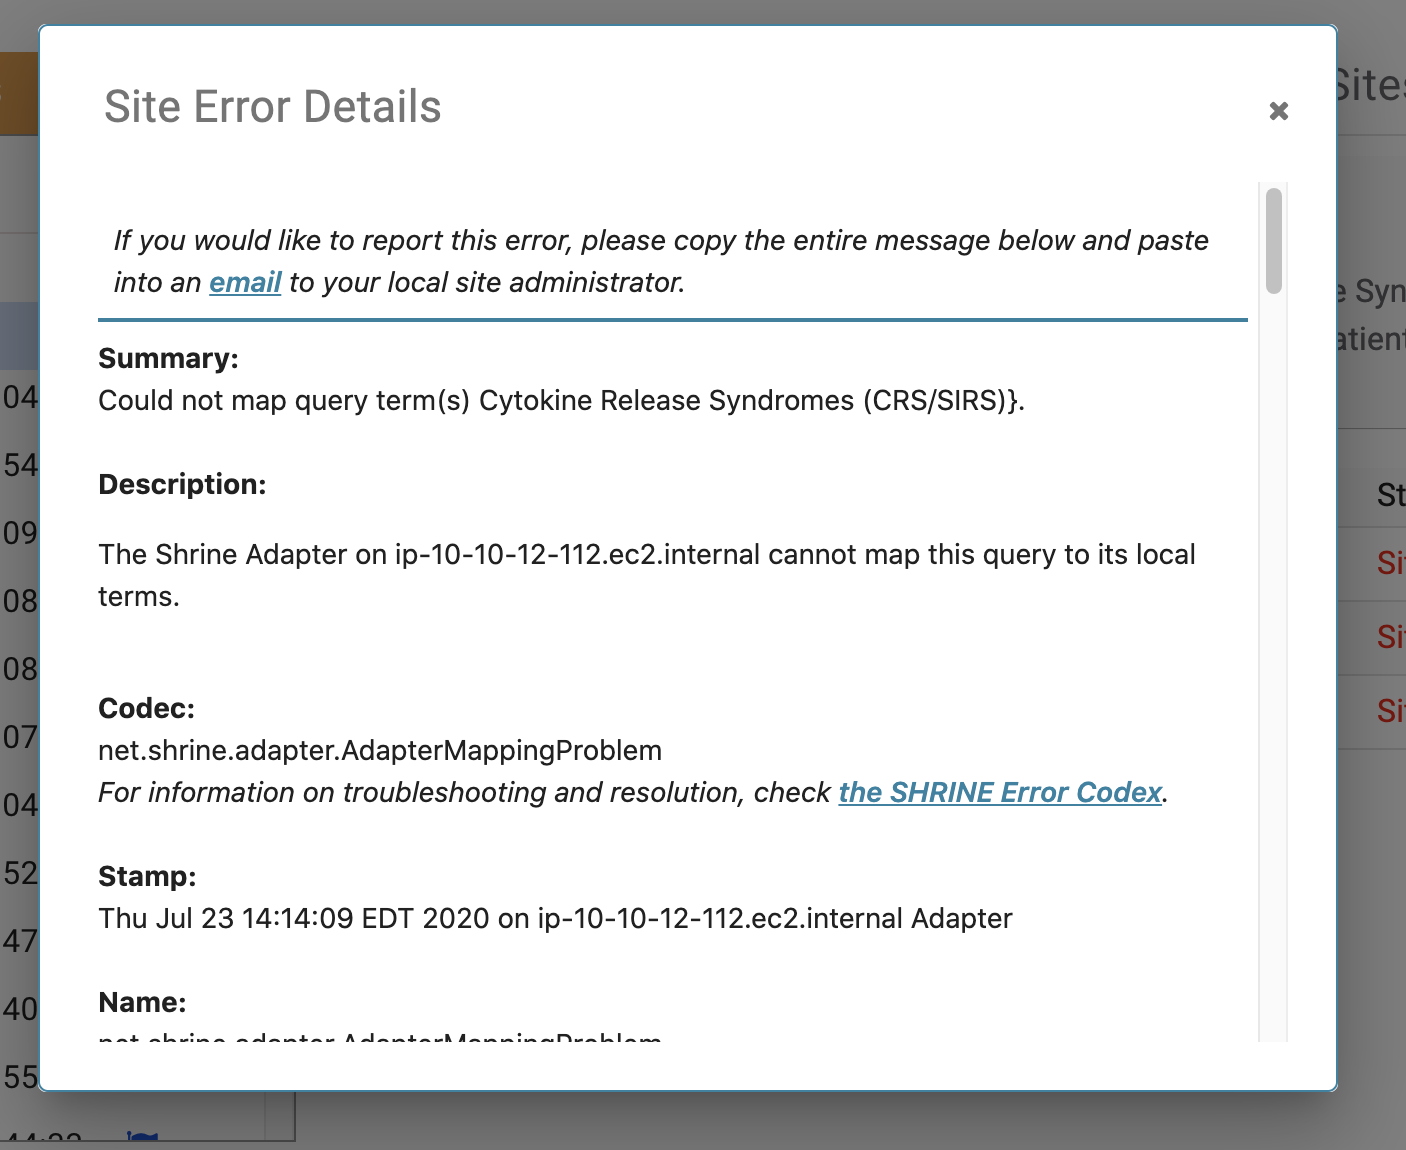
When a query is in process or when it contains errors at one or more sites, the status column will display the status at the sites instead of patient counts. In the example below all the sites in the network are returning an error.
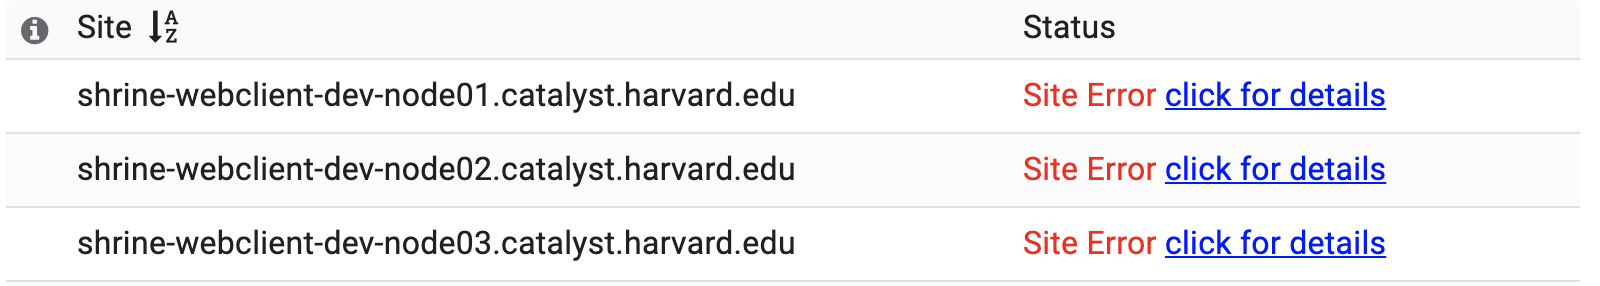
The user can click on one of the "click for details" links to get a more detailed description of the issue:
c. Edit Criteria Button
Clicking the Edit criteria will reconstruct the query and display it's definition in the find patients view.

The result of clicking the Edit Criteria button in our example is shown below. The user can now edit and re-run the query.
Overview
Content Tools