Page History
Tour of the Web Client
Introduction
The functionality described in the user guide assumes that you have received the necessary prior authorizations to access a SHRINE network at your institution. The process for this authorization varies according to your institution and network.
Most SHRINE networks use a tool called the Data Steward Application to request and approve query topics prior to use of the SHRINE Web Client. Your local administrator or network contact will provide information about this prerequisite step, if applicable.
Details of shots presented in this document may vary from network to network. Each network uses a different ontology and may be uniquely configured. We have attempted to note in this document where these situations may be expected. If you have questions, please contact your local network representative.
The SHRINE Webclient Contains 2 main views:
I. The Find Patients
...
...
I. The Find Patients View
| Anchor | ||
|---|---|---|
|
...
|
...
|
I. The Find Patients
...
Tab
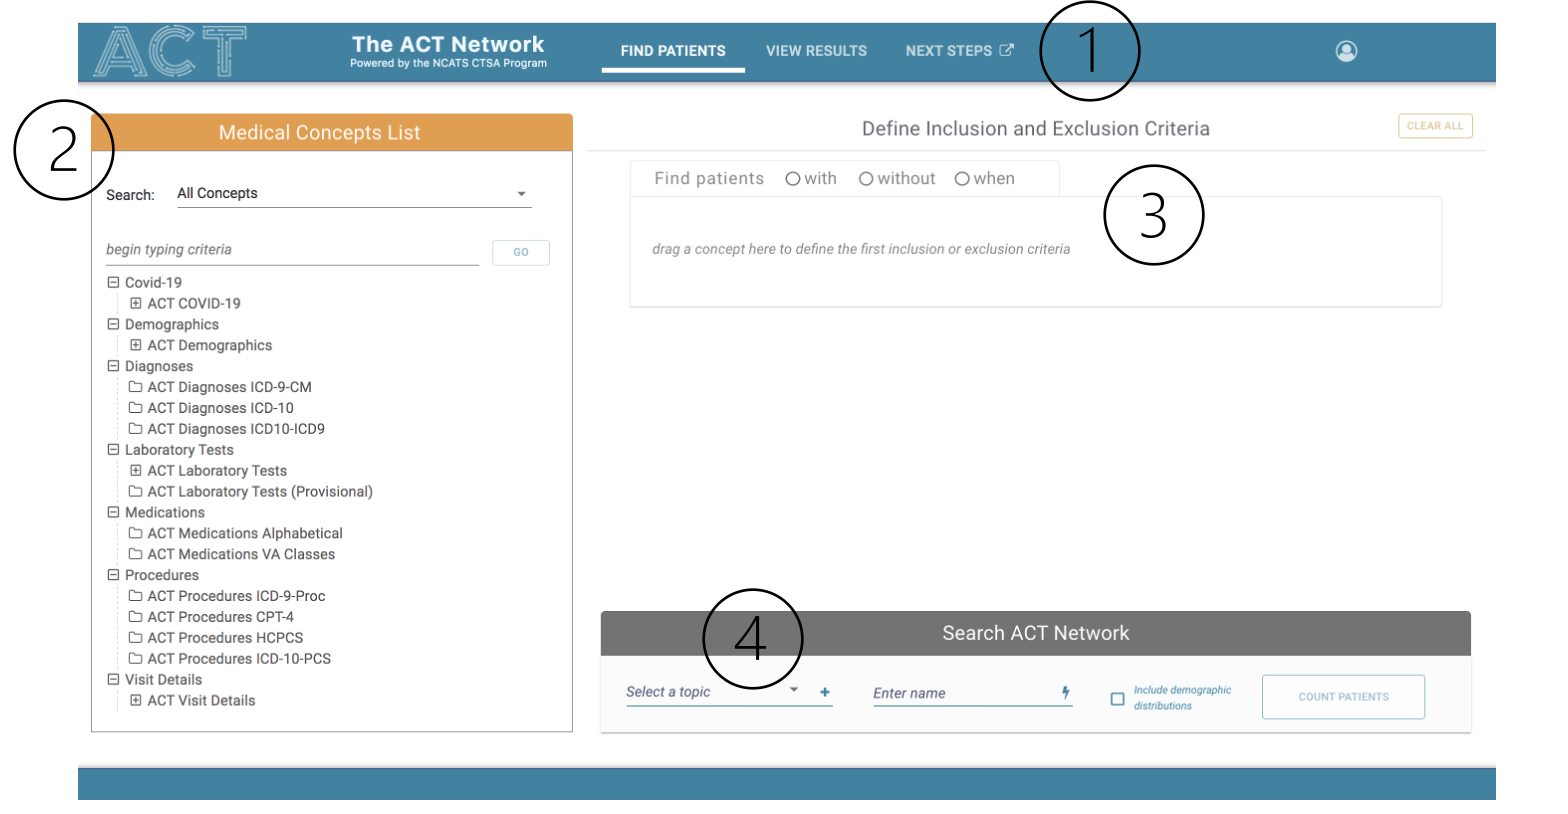
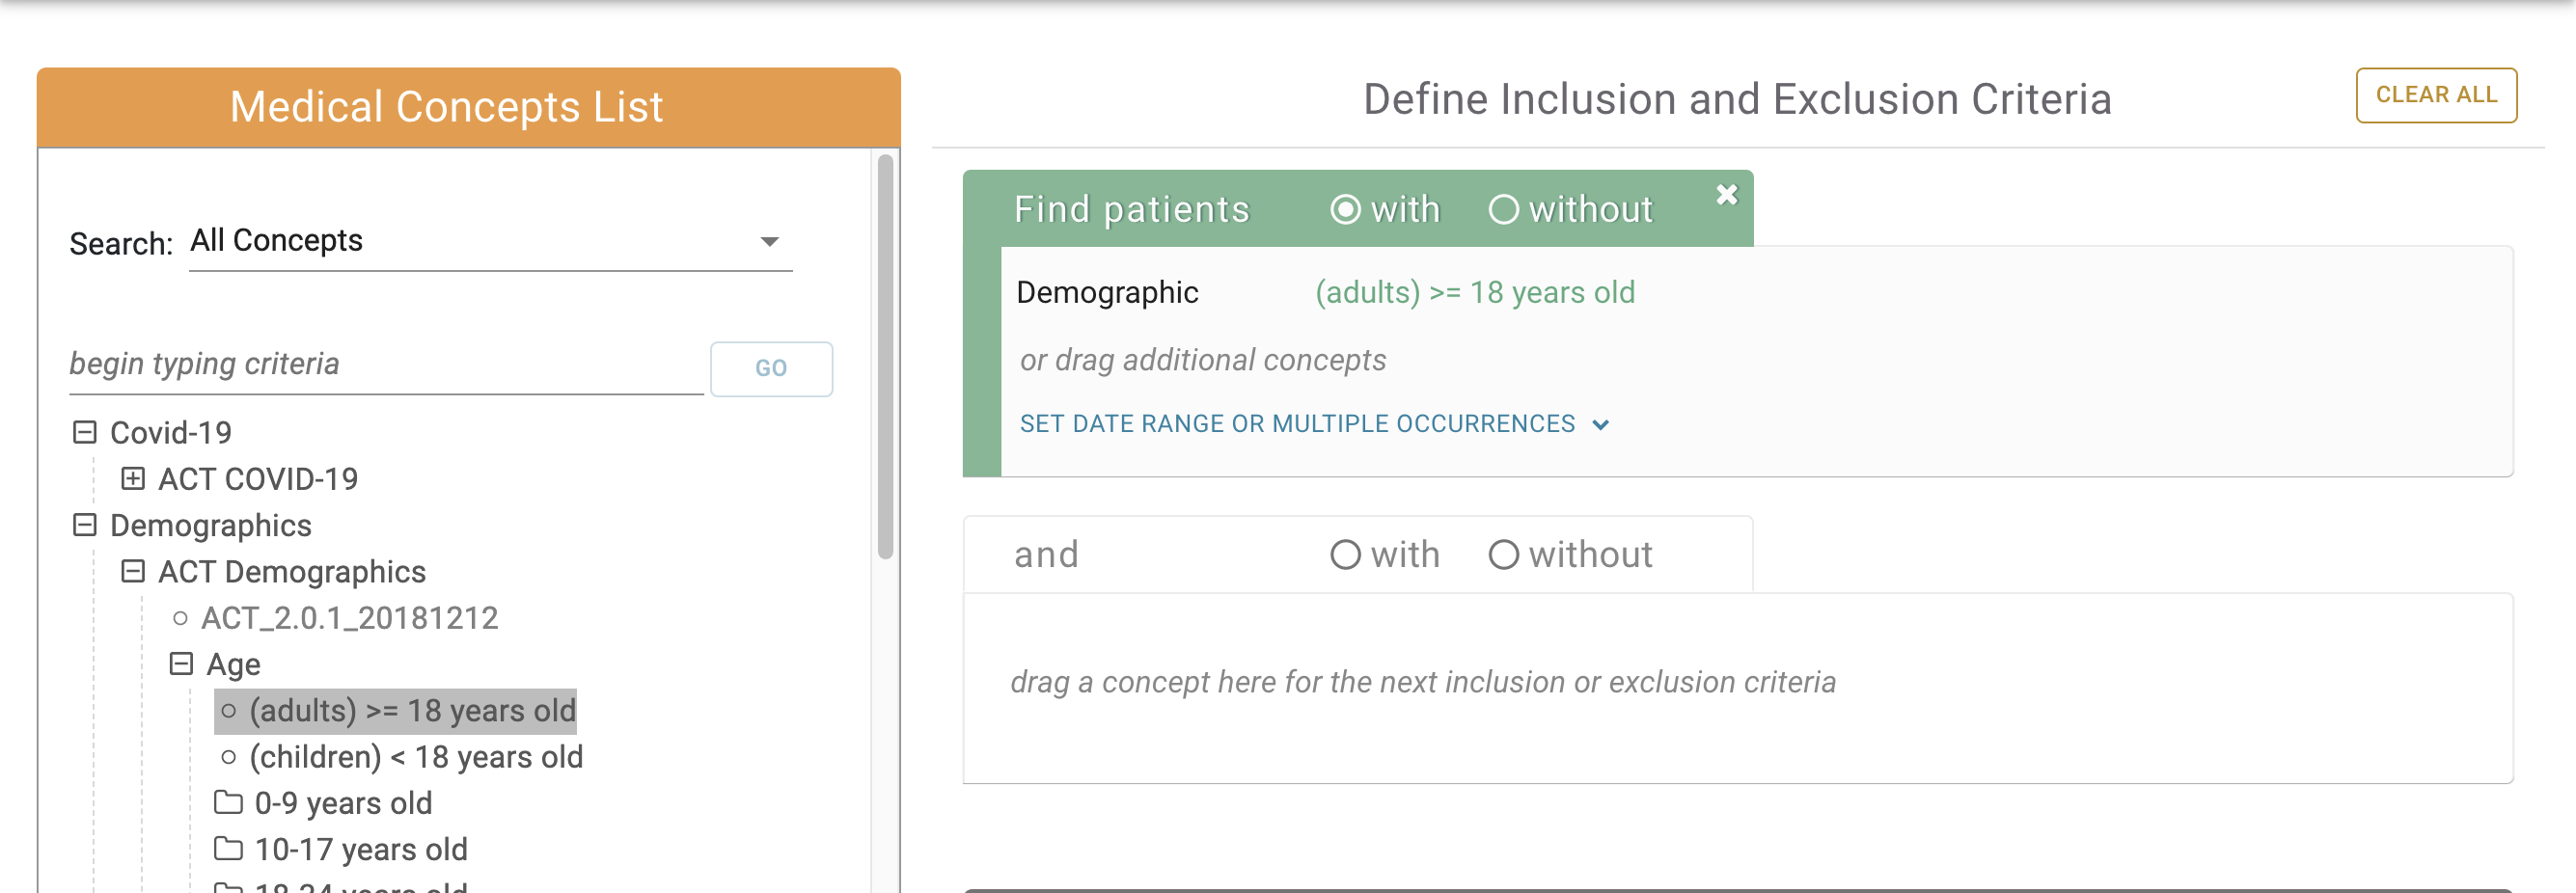
The default view on login is the Find Patients tab (1). Researchers will build and define their patient cohort by selecting and dropping medical concepts (2) into inclusion and exclusion criteria panel (3). Once defined, they can select various options before searching the network (4).
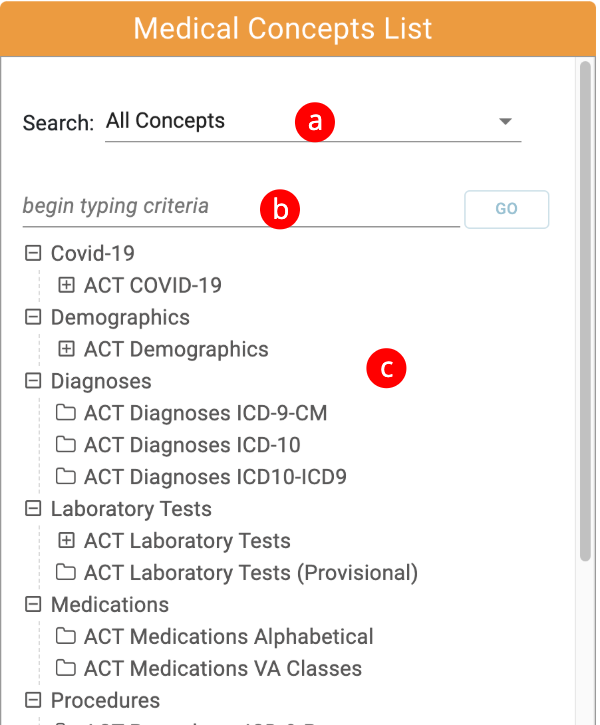
1. Medical Concepts List
The Medical Concepts List consists of
...
a - The Filter Drop Down menu.
b - The Search Field
c - The Medical Concepts Tree
a - The Filter Drop Down menu.
The Code Category Filter is used in combination with the search field to filter the concepts by category.
The filter will be applied to any searches performed by typing a search term in the Search Field and hitting the go button (see part b).
b - The Search Field
standardized medical billing domains that include diagnosis, procedures, laboratory tests, medications and demographics information and visit details. There are over 2 million concepts to select from. To help search and find the concept of choice, this panel contains features to help locate a specific code.
A researcher can type the medical concept and view corresponding search results (1), can select a filter to narrow down the domain of the search results (2), or can browse the medical concept tree by manually opening and closing folders (3).
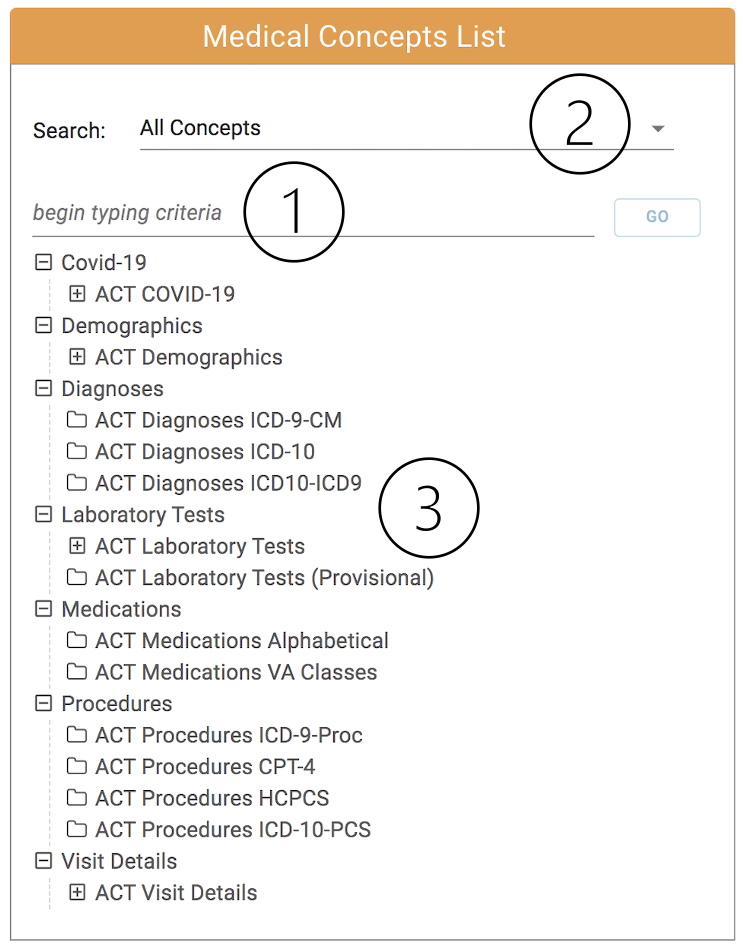
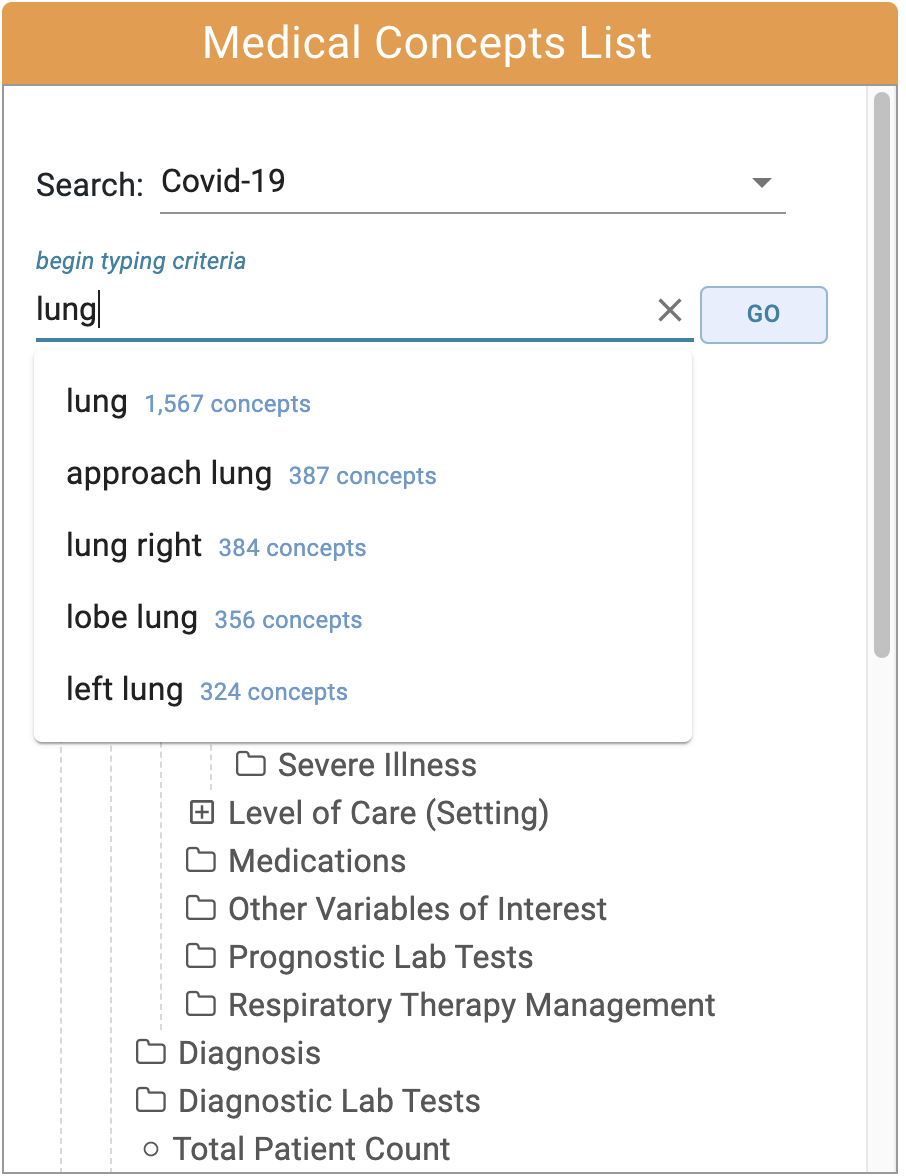
- Searching for a concept: As the user types in the search field,
...
- autosuggest terms will
...
- appear in a dropdown below
...
- . These terms are ranked by frequency of occurrence within the medical concept list. Select a term and click the "GO" button to view results below.
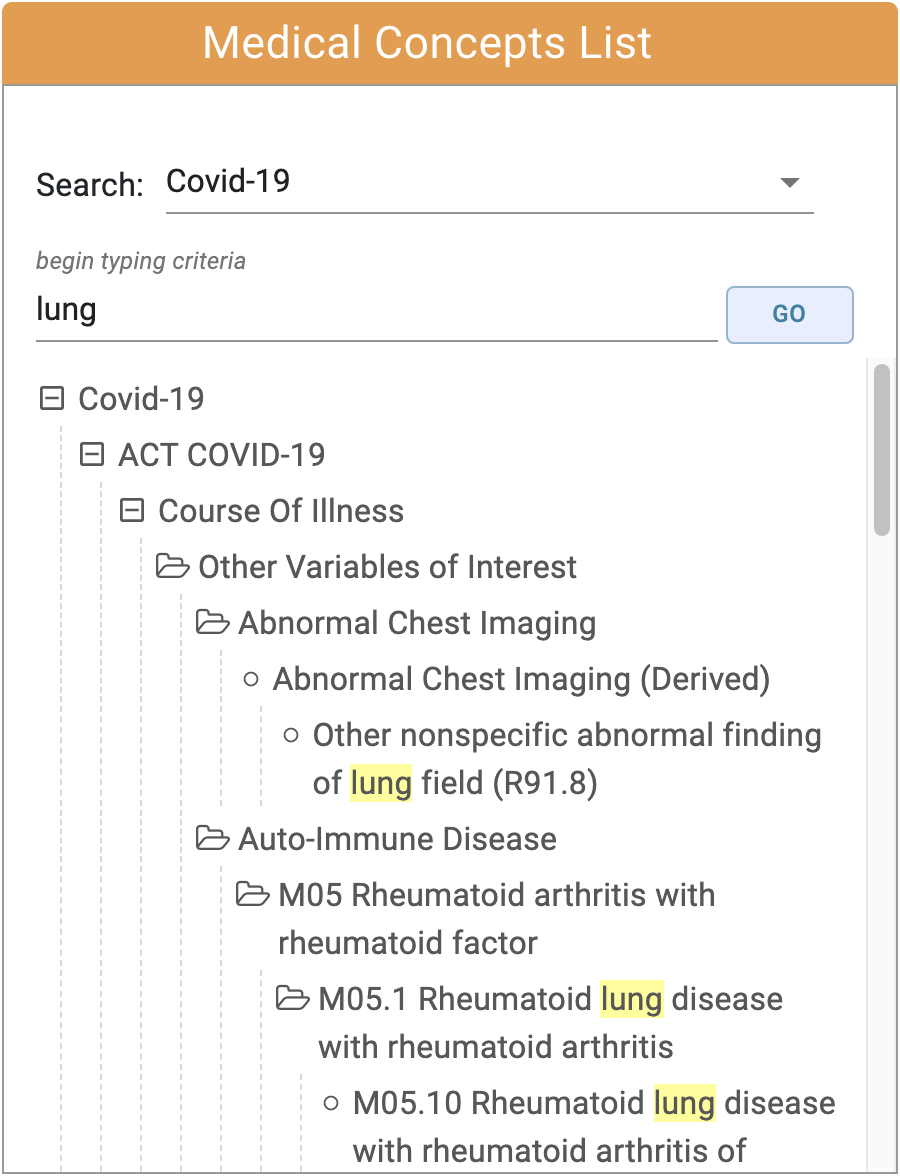
Autosuggest List Search Results with highlighted search criteria
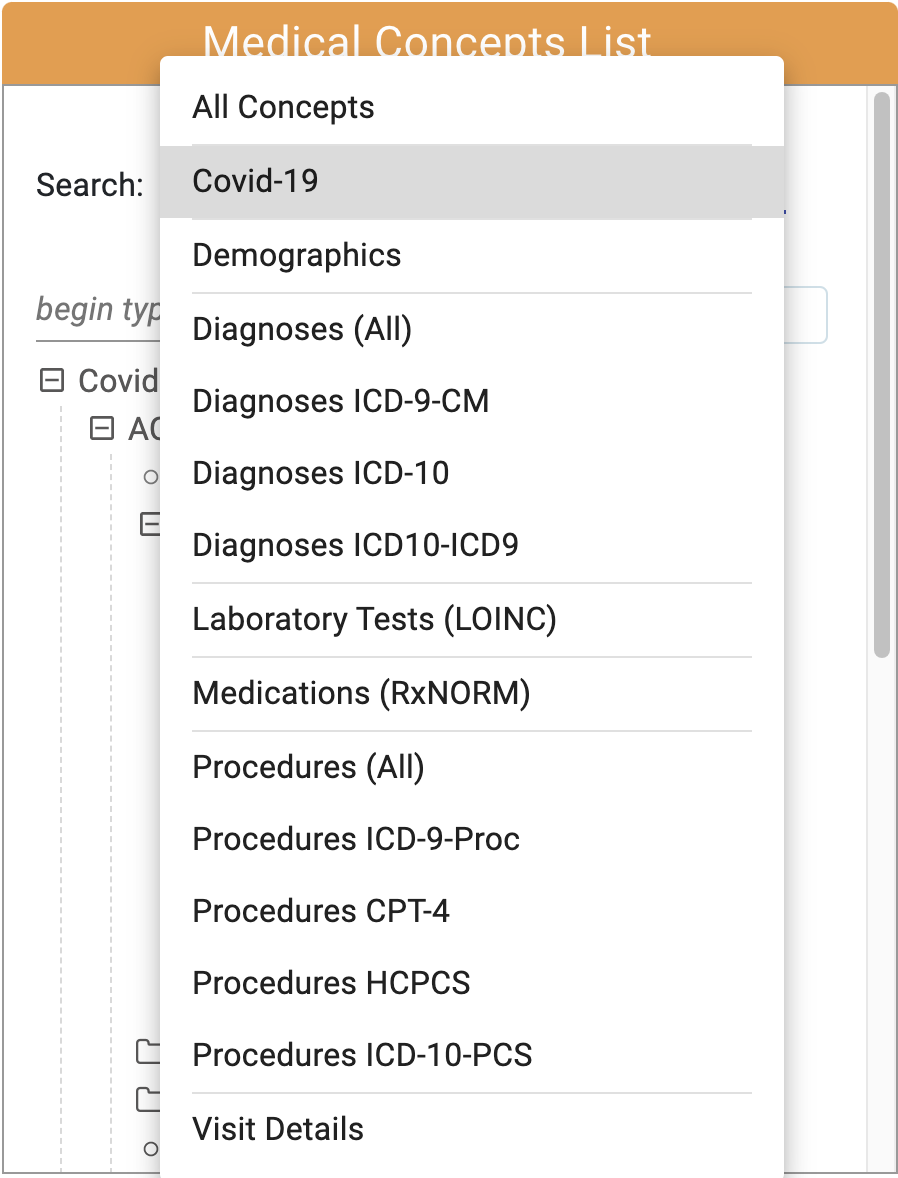
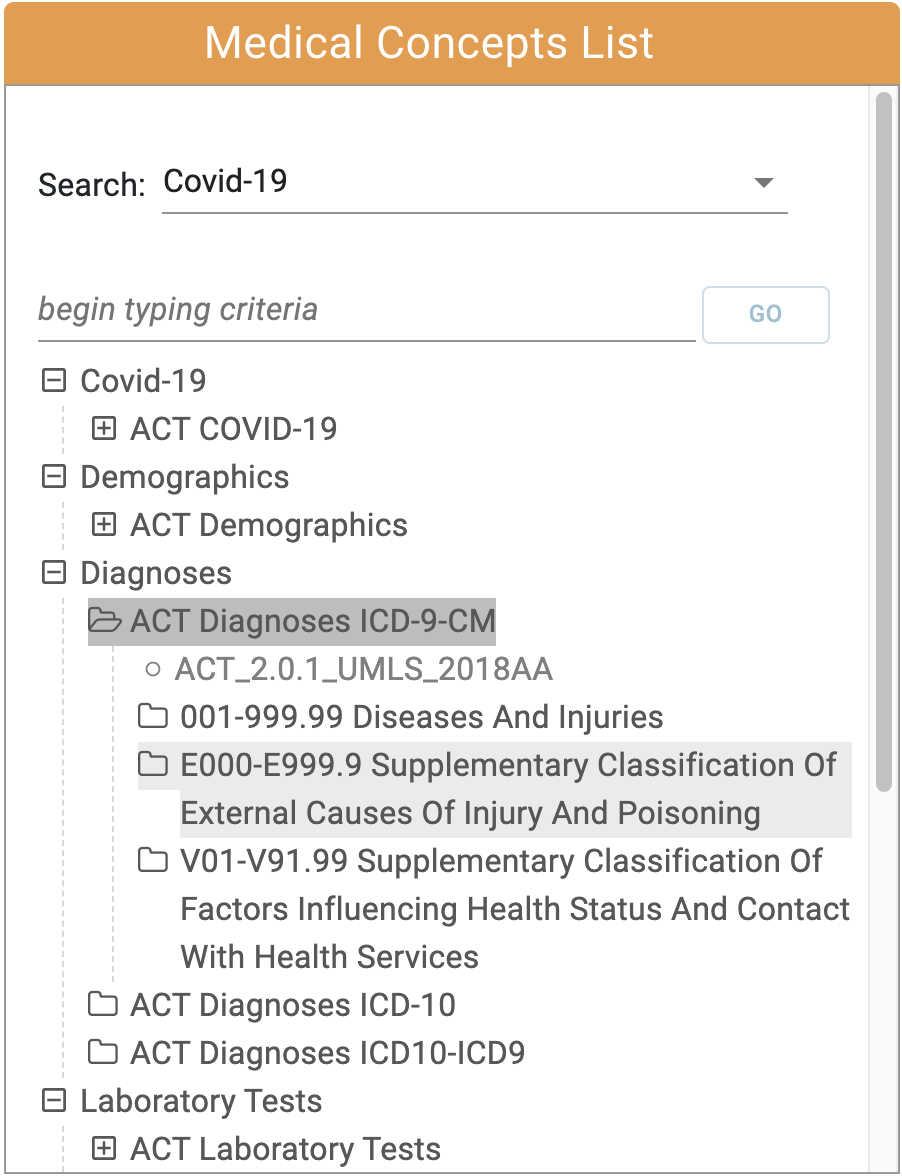
2. Narrow search results with the filter menu: The "Search" field defaults to search the entire medical concepts list. A researcher can specify a specific domain or code set by selecting from the drop down list. The filter and search input field work in tandem to help researchers find the concept of choice.
Filter by code domain or specific code category
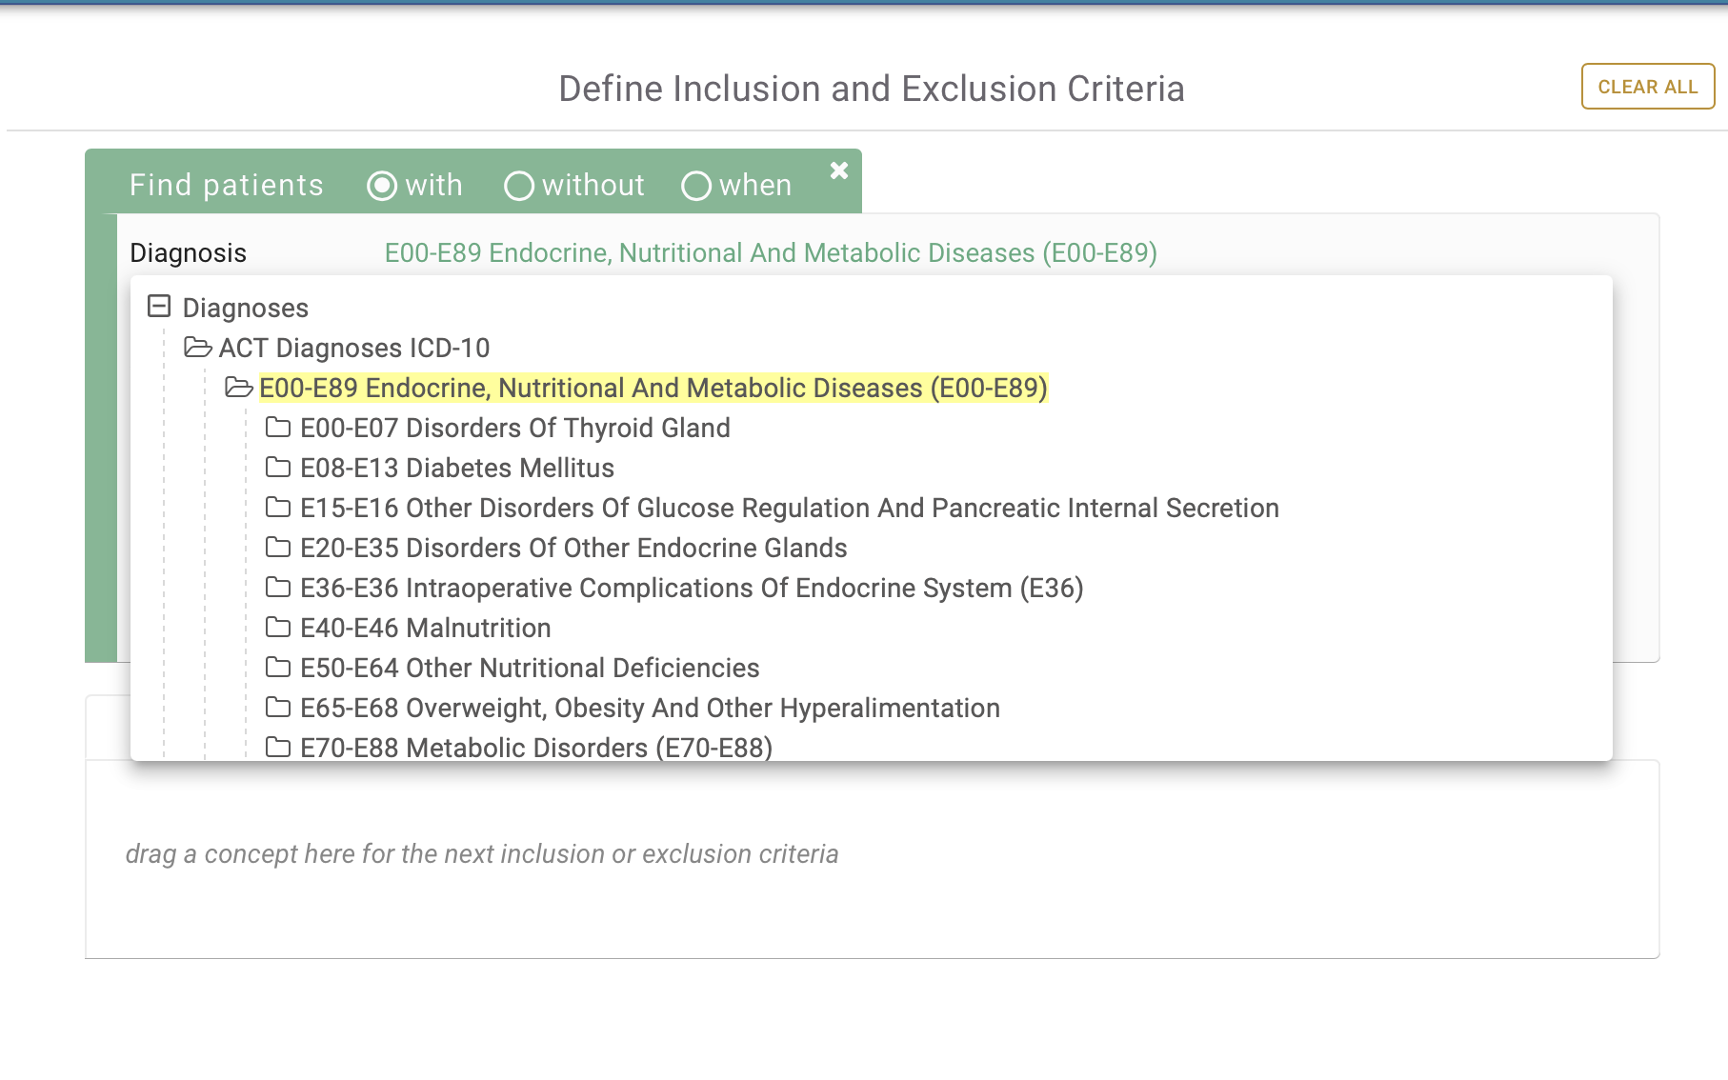
3. Browse the medical concept hierarchy. A researcher can browse the medical concept panel by expanding and collapsing the folder and drill down to locate a folder or an individual concept.
Click the concept to expand or collapse the folder
If the user selects a matching term and clicks the go button on the right, the filtered concept tree will appear.
...
.
2. Inclusion and Exclusion Criteria Panel
The
...
Inclusion and Exclusion Criteria panel is how researchers will define their patient population. After finding medical concept(s), simply drag and terms and drop it into the first group.
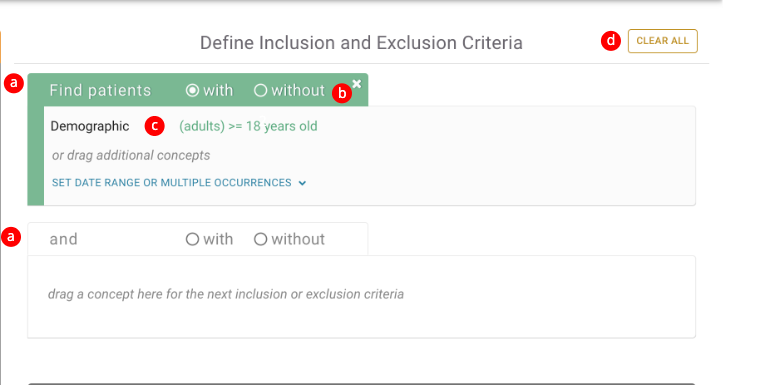
The first group will default to a green inclusion panel. Toggle to "without" to specify an exclusion panel or toggle to "when" to specify an event based panel (1). Additional concepts added to this group will be related to one another by the OR operator (2). Specify a date range or occurrence (3, 4, 5). Date ranges can start, end, or occur between selected dates (4). View the code within its relational hierarchy (6). Delete an individual concept from a group (7) or delete an entire group (8). Additional groups will automatically appear below, connecting each group by the AND relational operator (9). Clear out the entire panel with "Clear All" button (10).
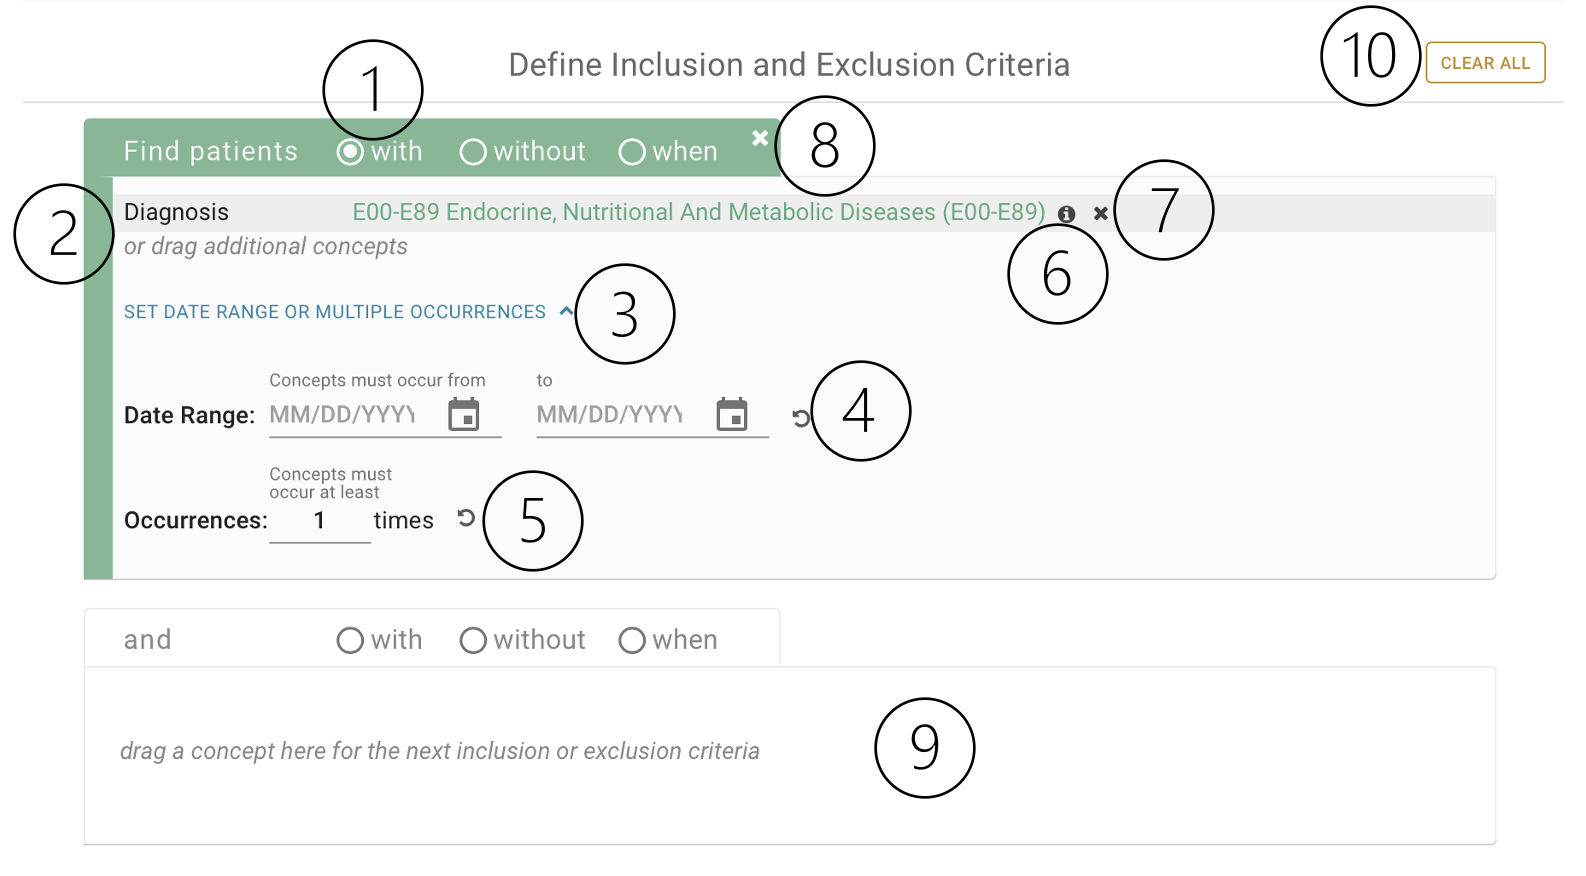
Click the info icon next to a concept to view its relational hierarchy
See examples of patient cohorts at the end of this document.
3. Event Based Panel
The event based panel allows researchers to construct a patient cohort with a sequence of events, where event A occurs before event B. To specify an event based panel, toggle to select the "when" radio button (1). The event panel contains 2 and only 2 events (2, 3). Each event must contain at least 1 concept. A researcher can specify the time gap between the two events (4, 5). An event based panel contains a clock icon to signify that it is a sequence based panel (6).
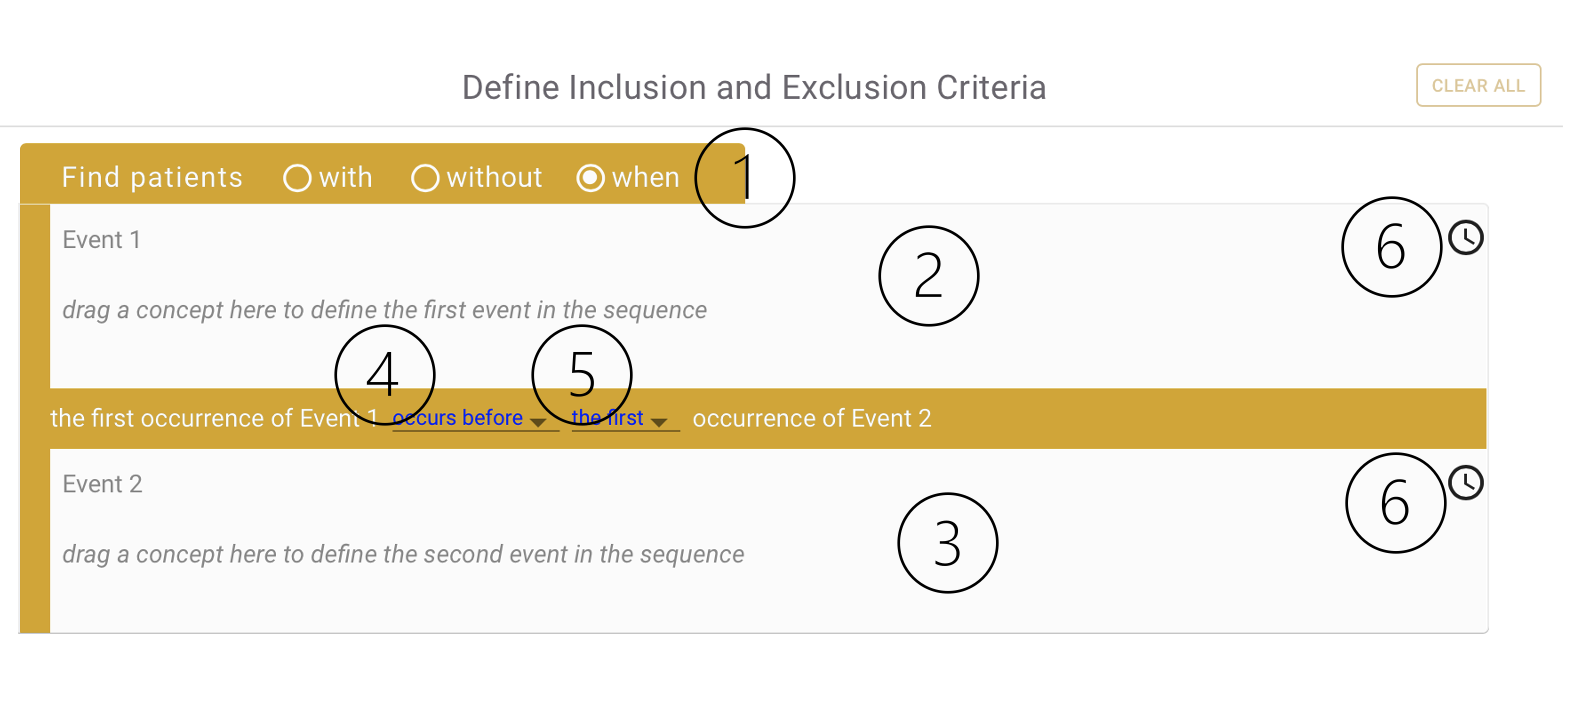
See examples of event based patient cohorts at the end of this document.
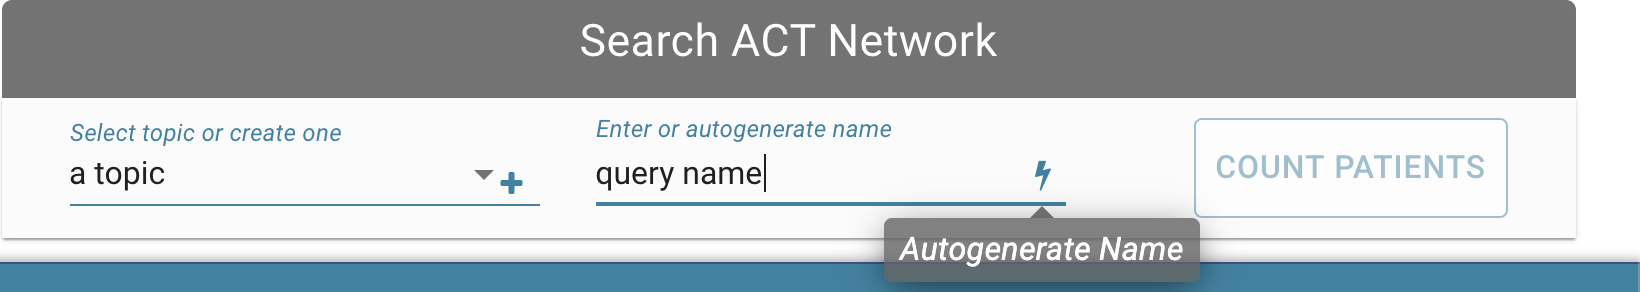
4. Search Network Panel
After defining the inclusion and exclusion panel, select or create a new research topic (1), enter or autogenerate a name for this patient cohort (2), elect to include demographic distributions (3), and click "Count Patients" to view results (4).
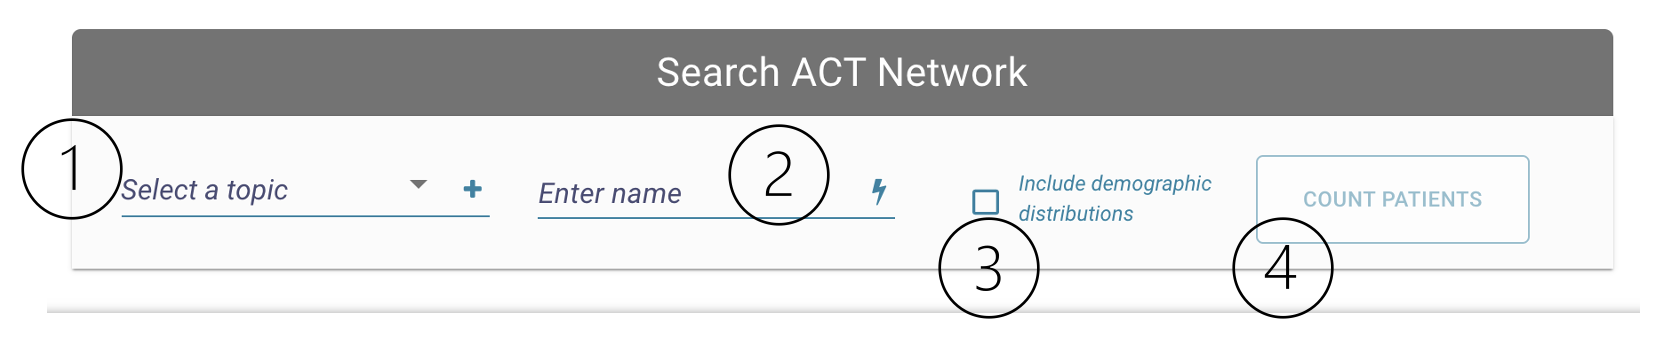
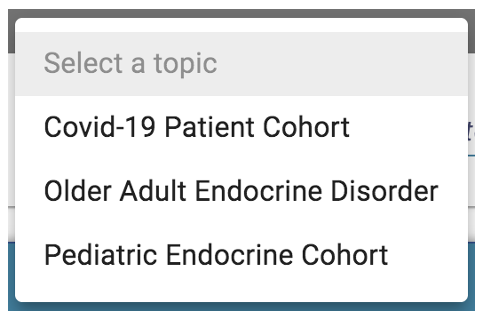
- Research Topic: A research topic must be selected, or opt to create a new one. Select a previously created topic, or click the "+" icon to create a new one.
b - With or Without Toggle
c - Concept Drop Area
d - Clear All button
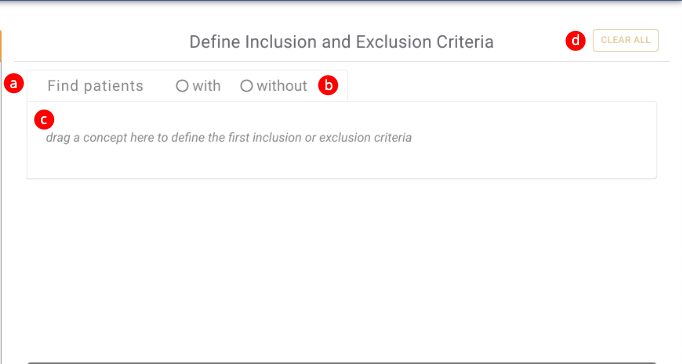
Concepts can be dragged from the medical concept list and dropped into the Concept Drop Area of a Medical Concept Group.
When a concept is dropped into a Medical Concept Group, some things to note are:
a. The Medical Concept Group that the concept was dropped into becomes active.
a. A new inactive Medical Concept Group is automatically added below the original.
b. The With or Without Toggle is set to "with" by default but can now be toggled to "without".
c. The new concept now appears in the Concept Drop Area and can be removed by mousing over the concept and clicking the x that appears.
d. The entire query can be reset by clicking the Clear All button.
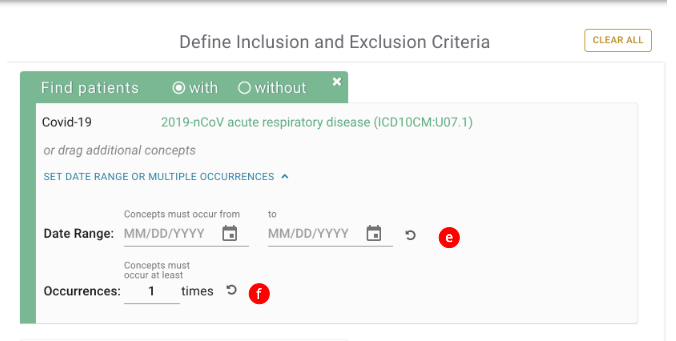
Setting the Date Range or Multiple Occurrences.
Using a different query containing a diagnosis of Covid-19 related Acute Respiratory Disease, we can demonstrate the ability to set the date range (e) and change the number of occurrences of the diagnosis (f). Please note that the date settings can contain either a start date or an end date or both.
3. Start Query Module
The Start Query Module Consists of:
a - The Query Topic Selection.
b - Query Name field.
c - The Count Patients Button

A Query Topic must be selected and a Query Name must be entered into the Query Name field before a query can be run.
a. Query Topic Selection
A user must select a query topic before running a query.

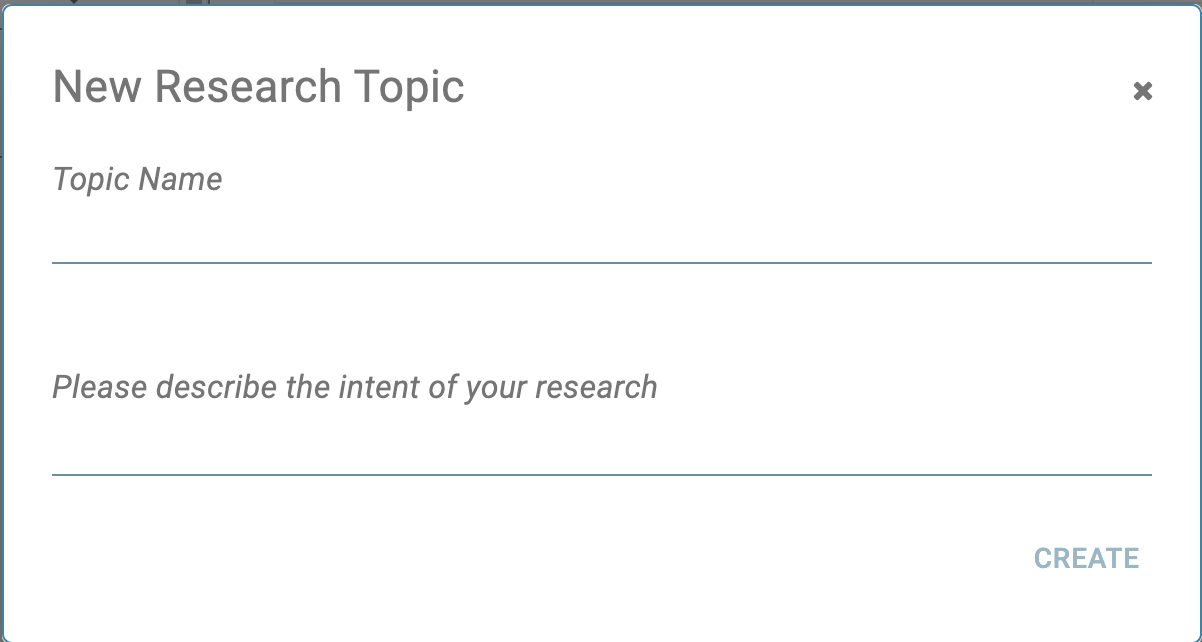
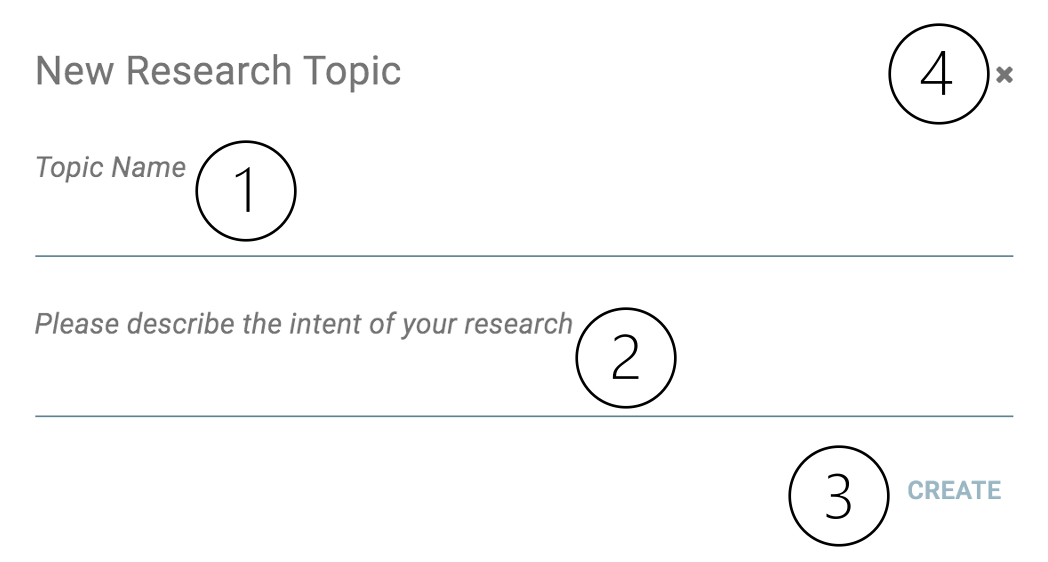
If no query topics exist, clicking the "+" button to the right of the Query Topic Selection will allow the user to create a topic.
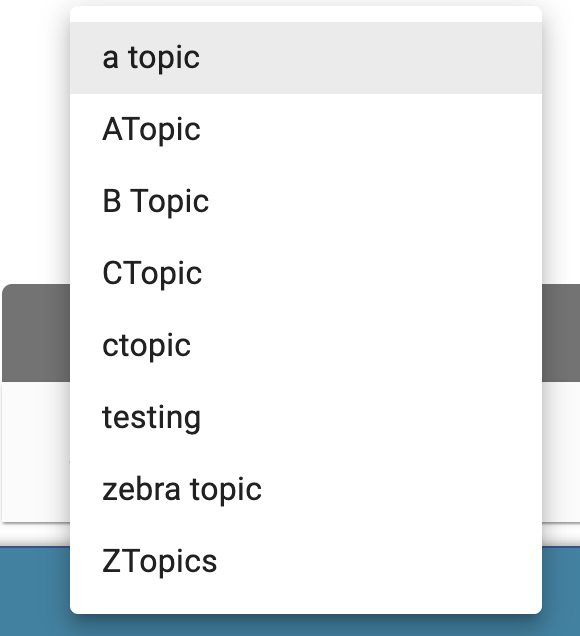
- After creating a topic, it will show up in the topic drop down where it can be selected.
...
Select a previously created topic
New Research Topic window. Include the topic name (1), description (2), and click "Create" (3). Click the "x" icon to exit the window (4).
2. Name Field:
b. Query Name Field
In addition to the
...
Research Topic
...
, the
...
Name Field is required before
...
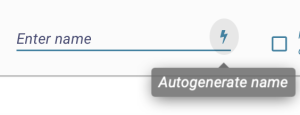
searching the network. A researcher can enter a name, or click the thunderbolt icon to have a name autogenerate.
3. Demographic Distributions: Selecting this checkbox will include a graphical display of the patient cohort by dimensions of age, race, sex, and vital status. This will be visible on the View Results tab.
4. Count Patient button. When all required fields are complete, and errors are cleared out, the Count patient button will become enabled.
Disabled button Enabled button


| Anchor | ||||
|---|---|---|---|---|
|
II. View Results Tab
The View Results tab (1) is divided into 2 main panels - The Previous Results panel (2), and the View Patient Counts by Sites (3). The Edit Criteria button seamlessly reloads the entire criteria set back into the Find Patients tab (4).
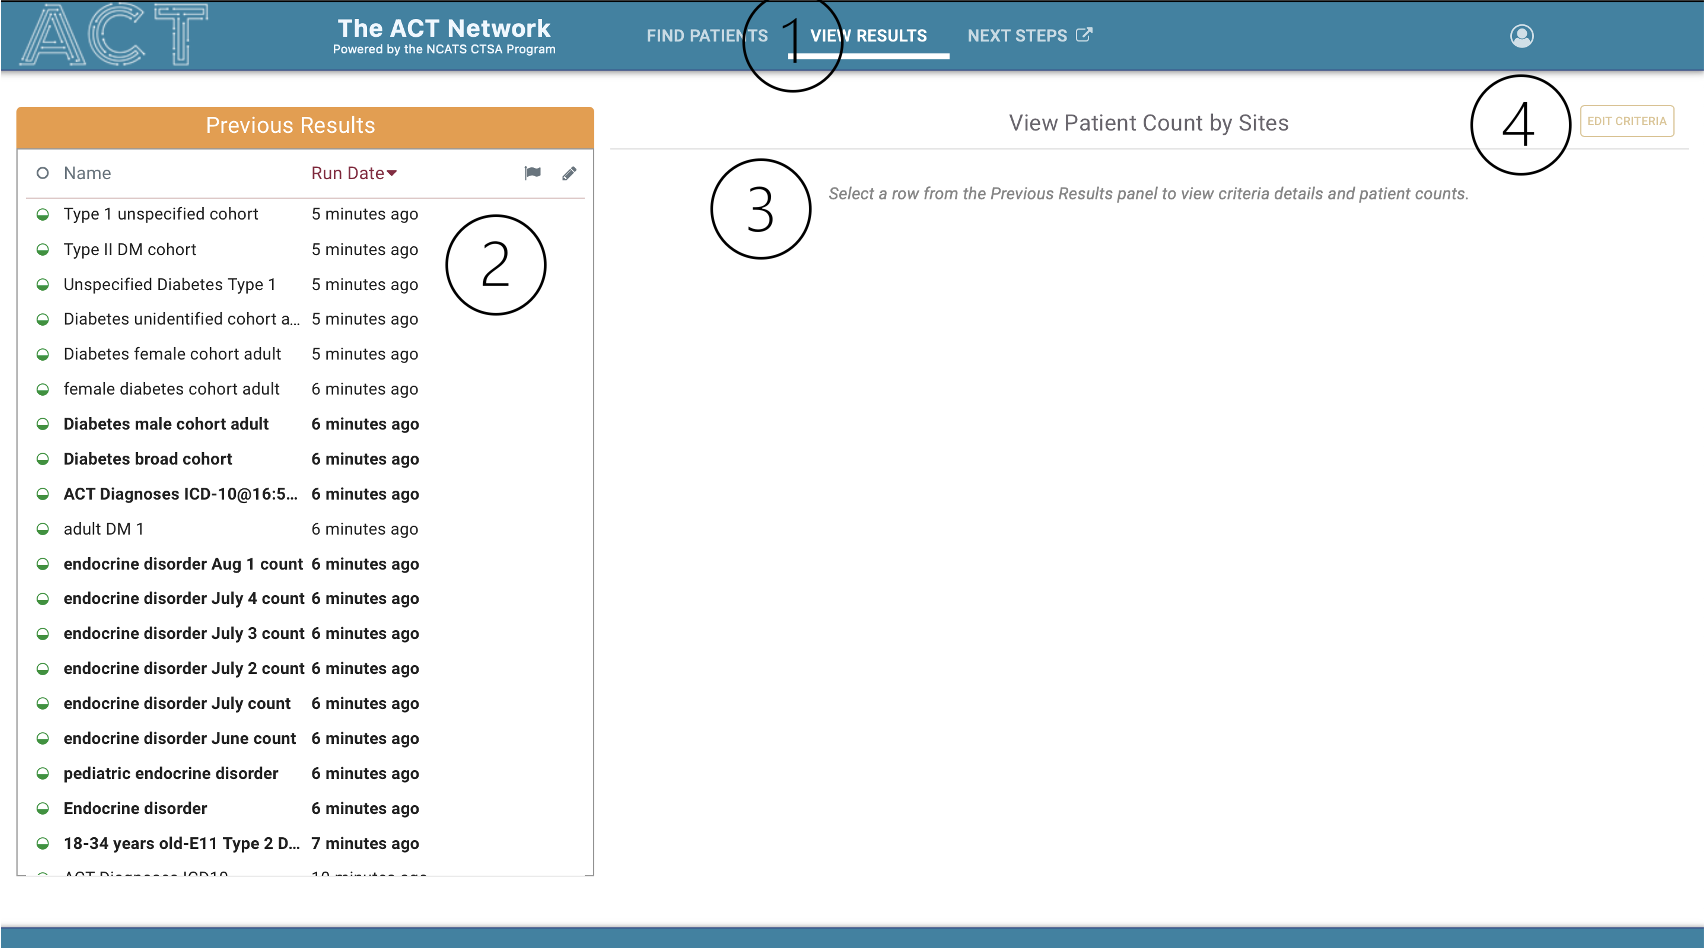
1. Previous Results panel
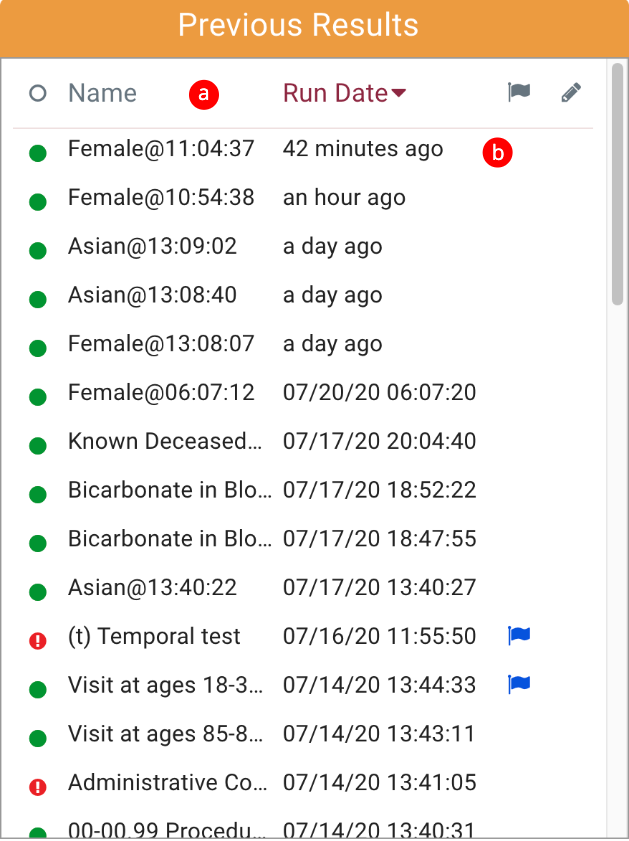
Allows researcher to view the results of patient cohort criteria that are currently in progress or have already completed. Each row contains a status indicator (1), name, date/time stamp (2), and the ability to flag a query (3), or edit the name (4). Default sorted by recent run date (2).
- Status Indicator. The dot provides an update on the query.
- A green half filled circle indicates a query that is in progress.
- A green filled circle indicates a successfully completed query
- A red filled circle

A user can autogenerate a query name by clicking the lightning graphic on the right:
b. Count Patients Button
When all required fields are populated on the form, the user can click the Count Patients button to start a query.
The Count Patients button will automatically disable if any required fields are missing.
II. View Patient Counts
View Results is divided into 2 modules: 1 Previous Results, 2 Patient Counts. The main menu 3 can be used to switch between the Find Patients and View Results Views.
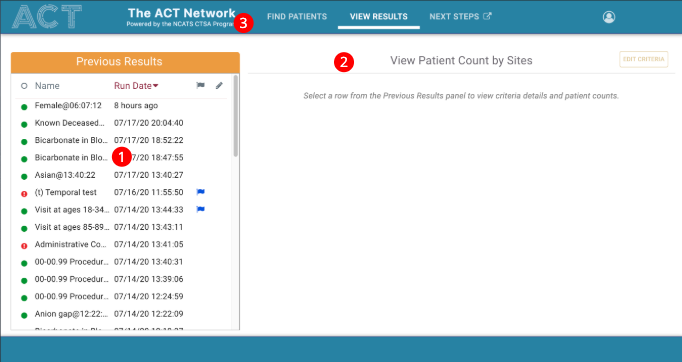
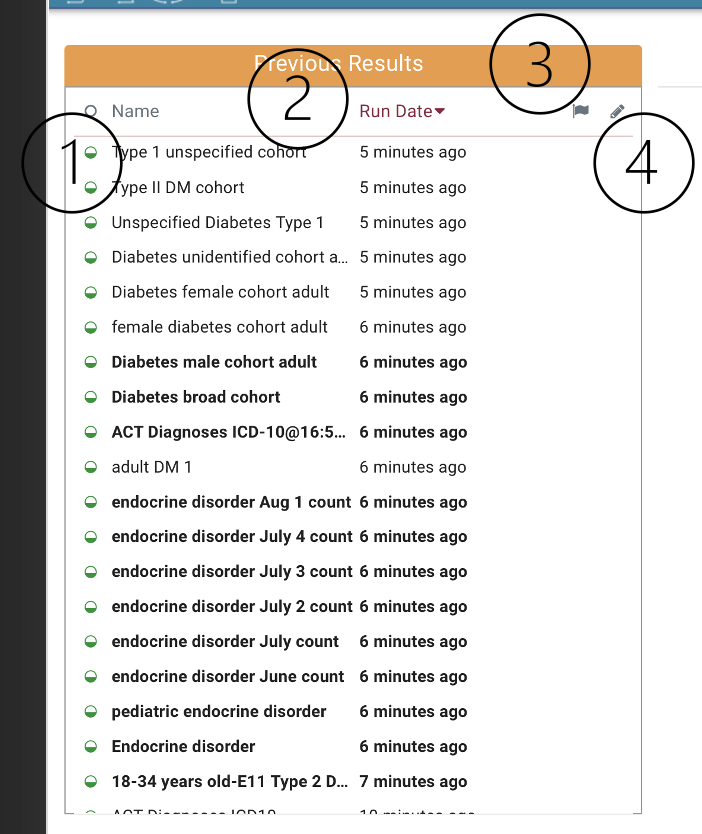
1. Previous Results Module
The Previous Module Consists of:
a - The Previous Results Header.
b - Previous Results
a. The Previous Results Header
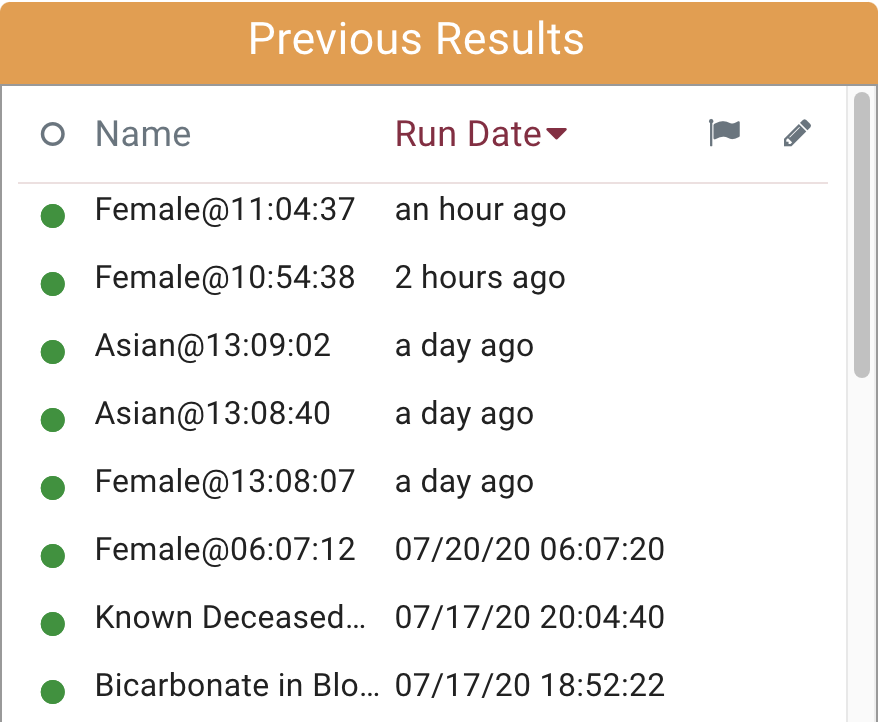
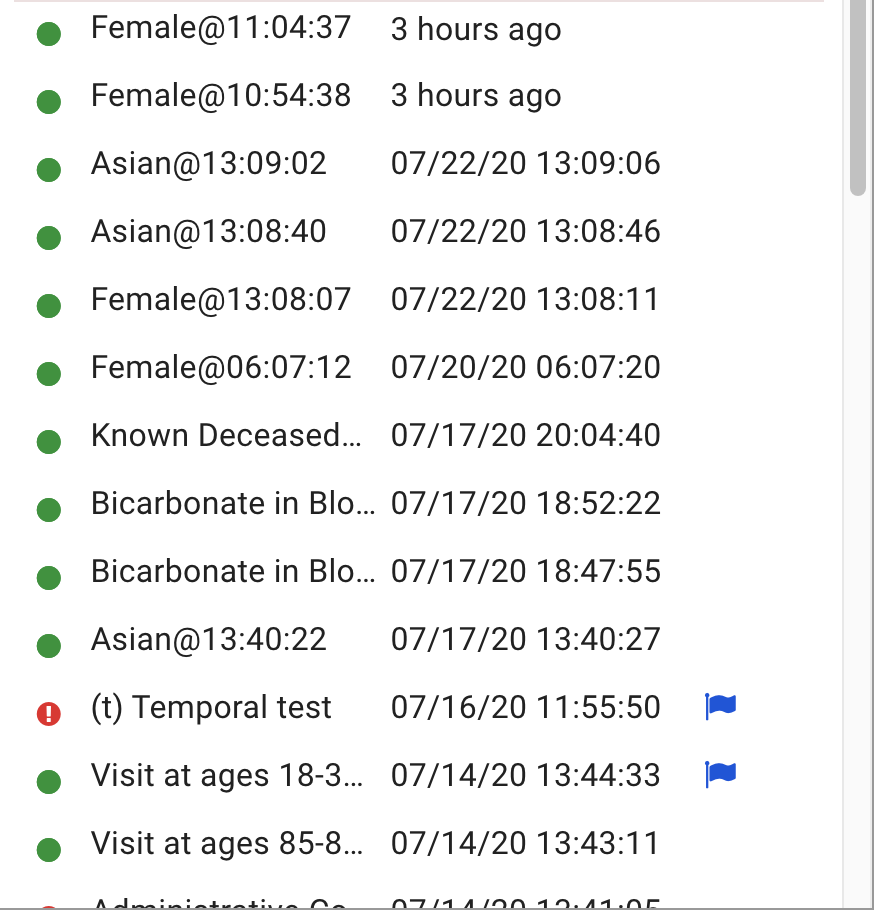
The Previous Results Header provides the ability to sort the Previous Results by Query Name, Run Date and Flag Status. In the example below, the Previous Results are sorted by Run Date with the most recent results sorted at the top of the table:
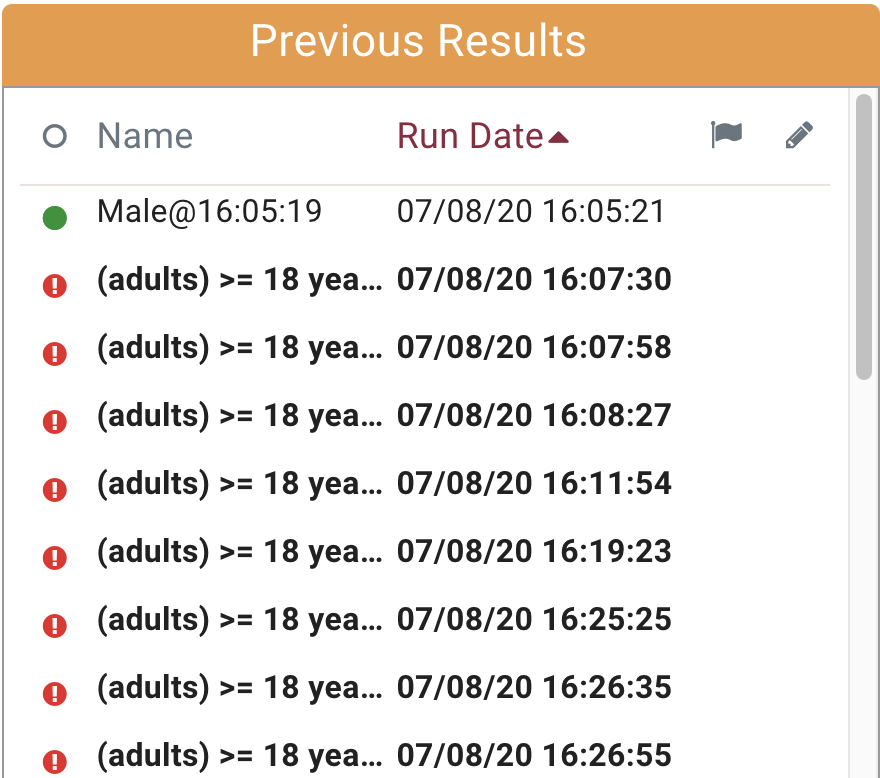
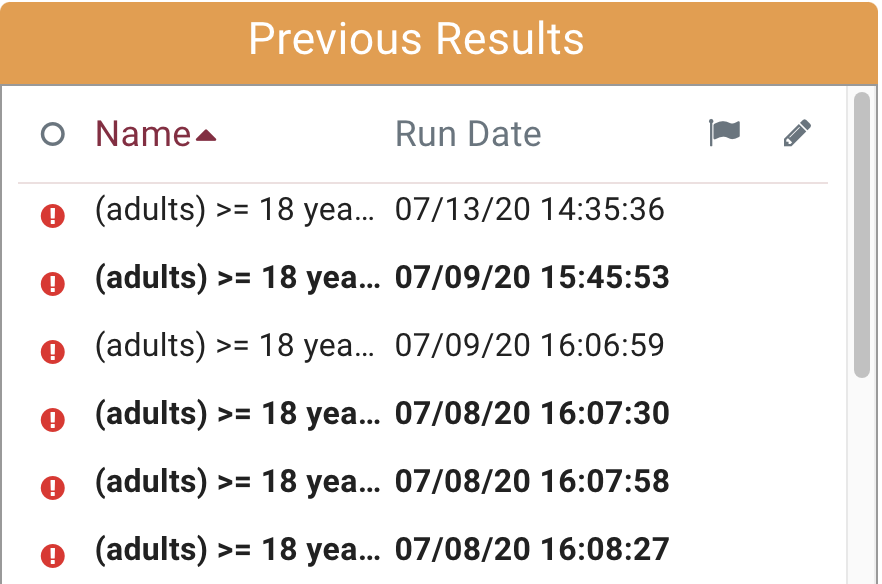
In the following example the Previous Results are sorted by Run Date with the least recent results sorted at the top of the table:
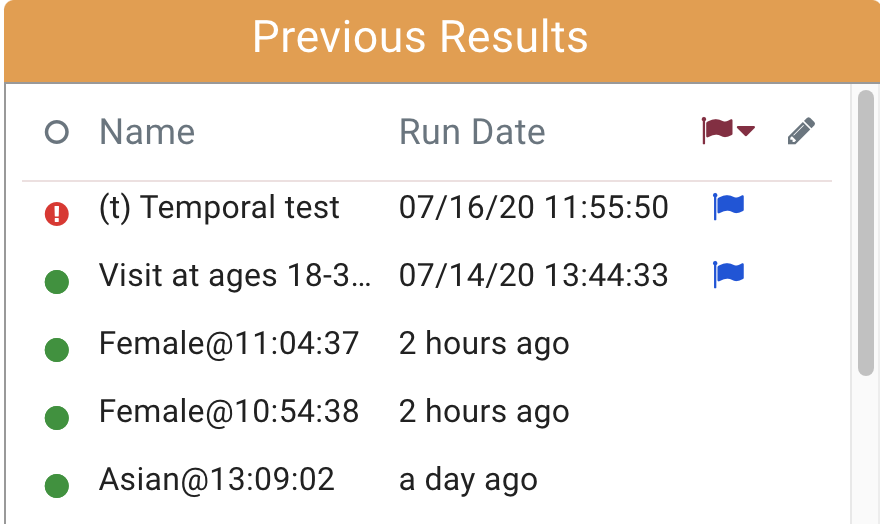
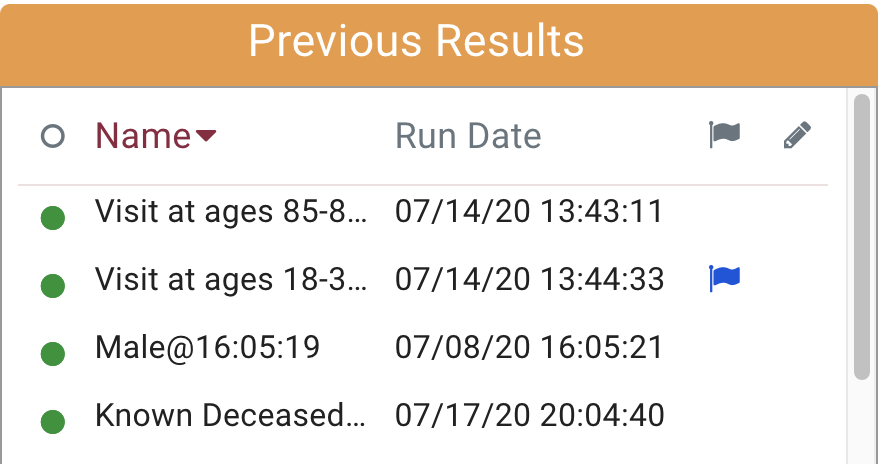
In the following example the results are sorted with flagged queries at the top of the table:
In the following example the results are sorted in alphabetical order:
In the following example the results are sorted in reverse alphabetical order:
b. Previous Results
The previous results are queries that are either currently in progress or have already completed.
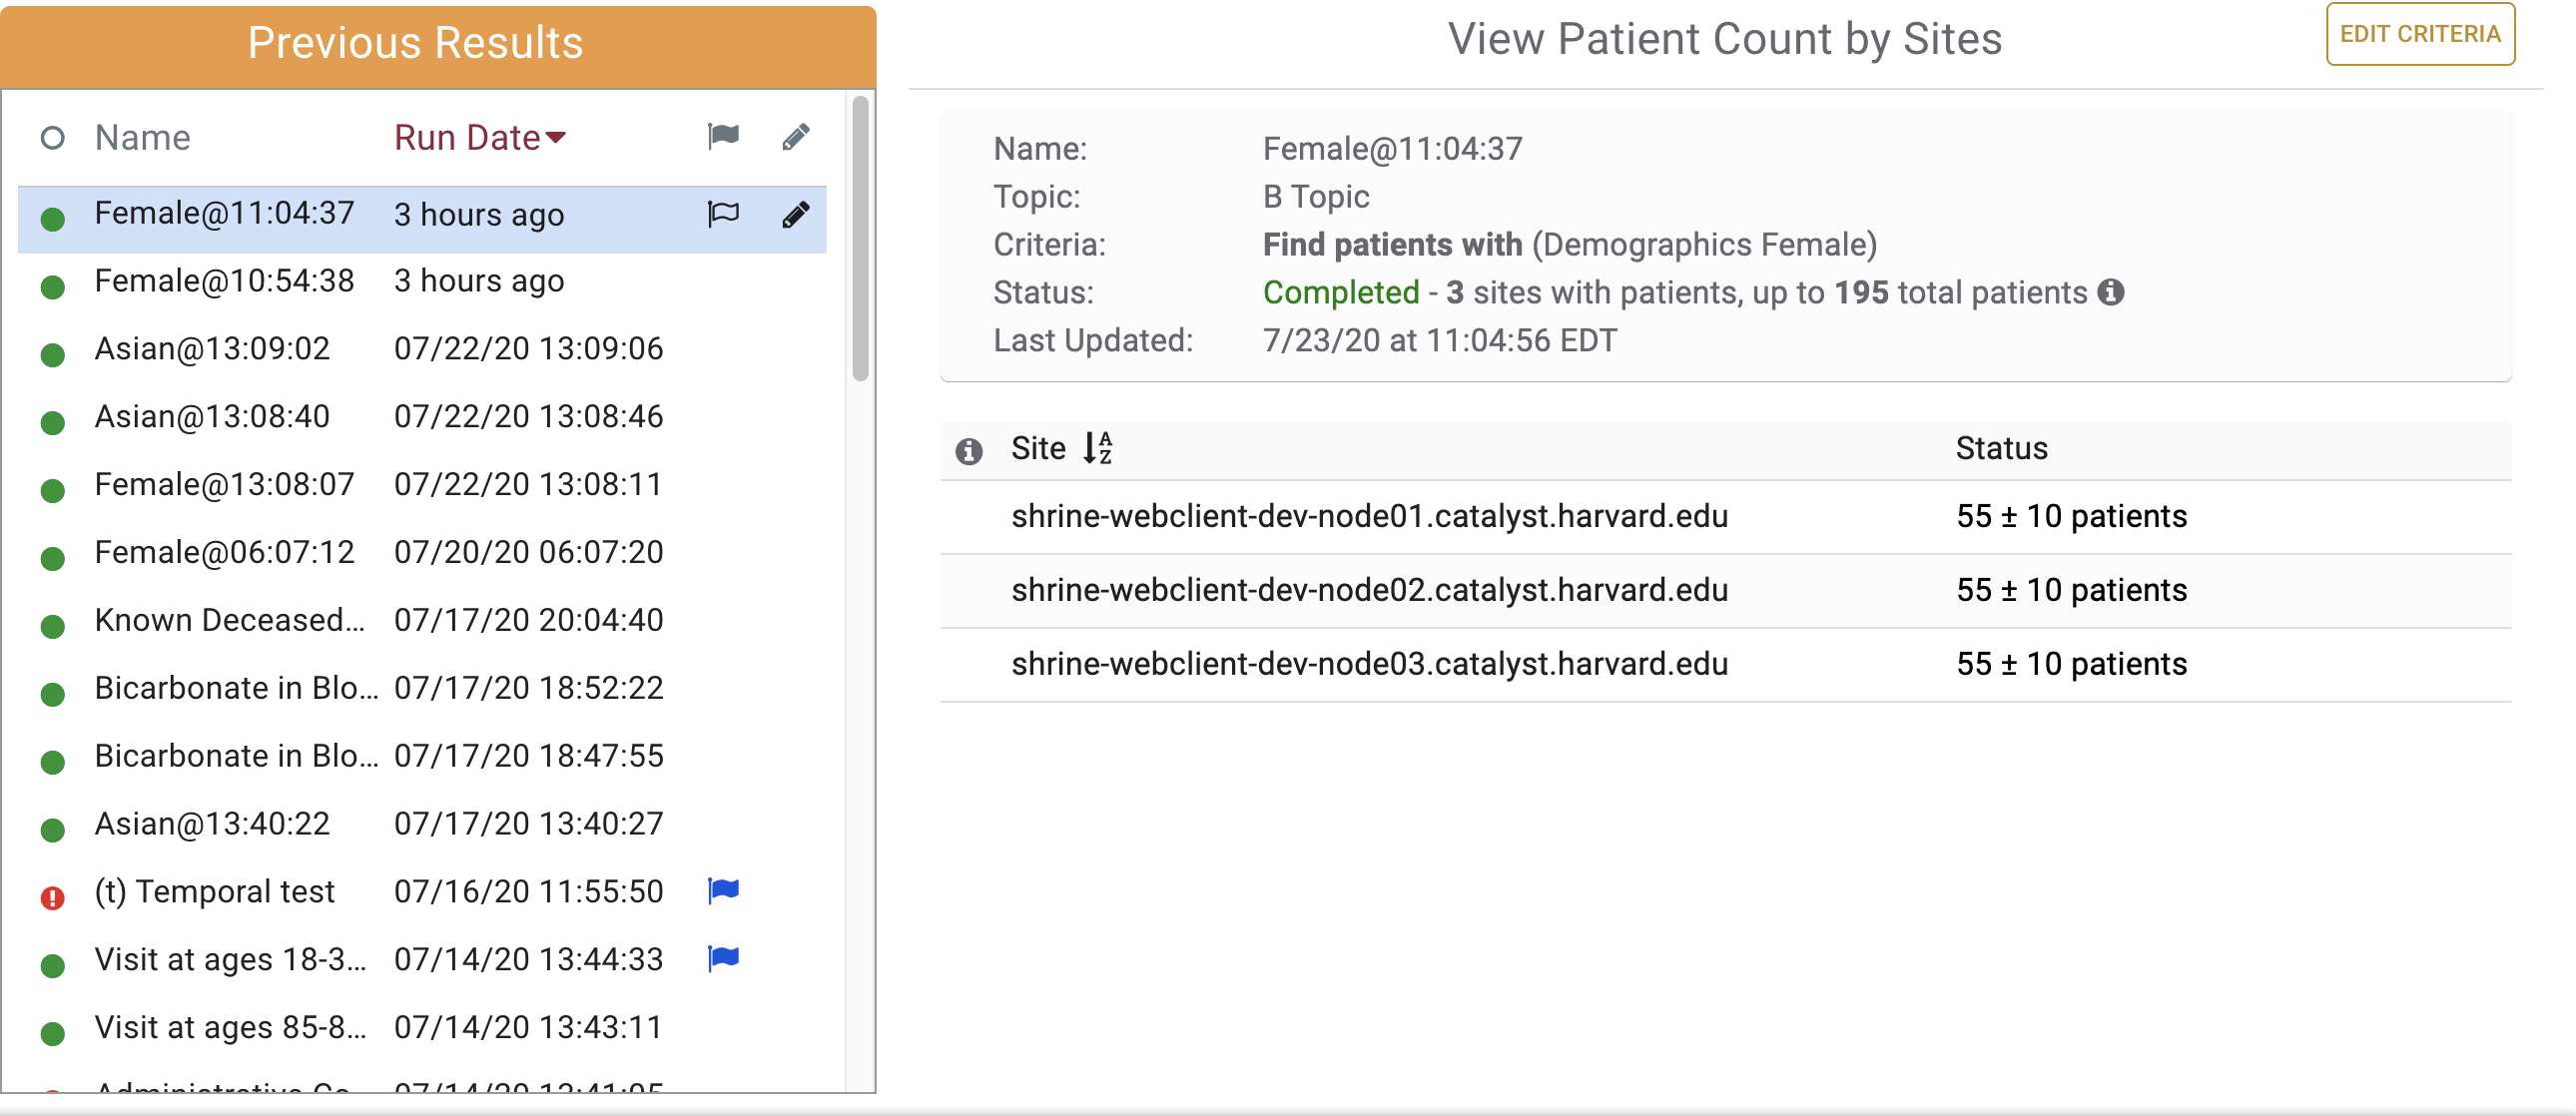
Clicking on one of the queries will retrieve its results as seen below. The right hand section titled View Patient Count By Sites will be described in more detail later on in this tutorial.
Query Status Indicator Column
...
- indicates a query that had an error retrieving results
...
2. The default sort is by recent run date. The previous results panel can also be sorted by status and name.
3. Flag a row to begin the process of obtaining medical
4. Click the pencil icon to edit the name.
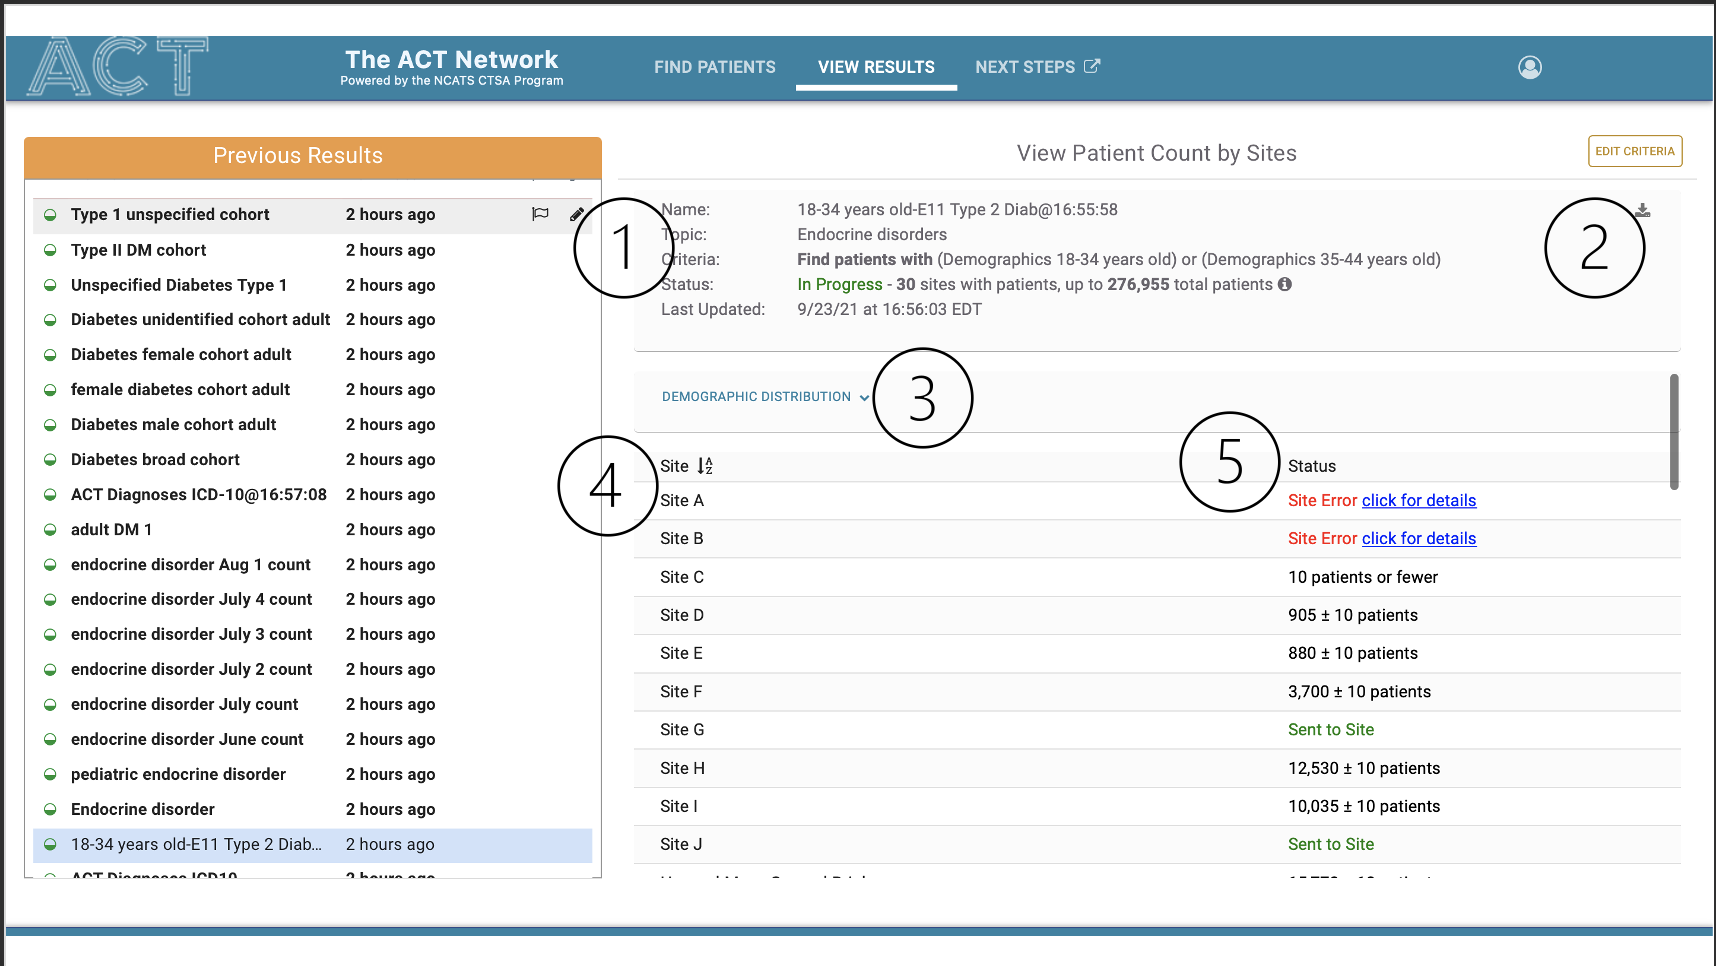
3. View Patient Counts by Sites
Select a row from Previous Results to load the results in the View Patient Count by Sites panel. Information about the inclusion and exclusion criteria is displayed (1) including a readout of the criteria. A researcher can download a CSV file of the sites and corresponding counts (2). Demographics Distributions, if selected, are collapsed by default (3). Counts are default sorted in alphabetical order (4, 5), and can be sorted by site name (4) or status (5).
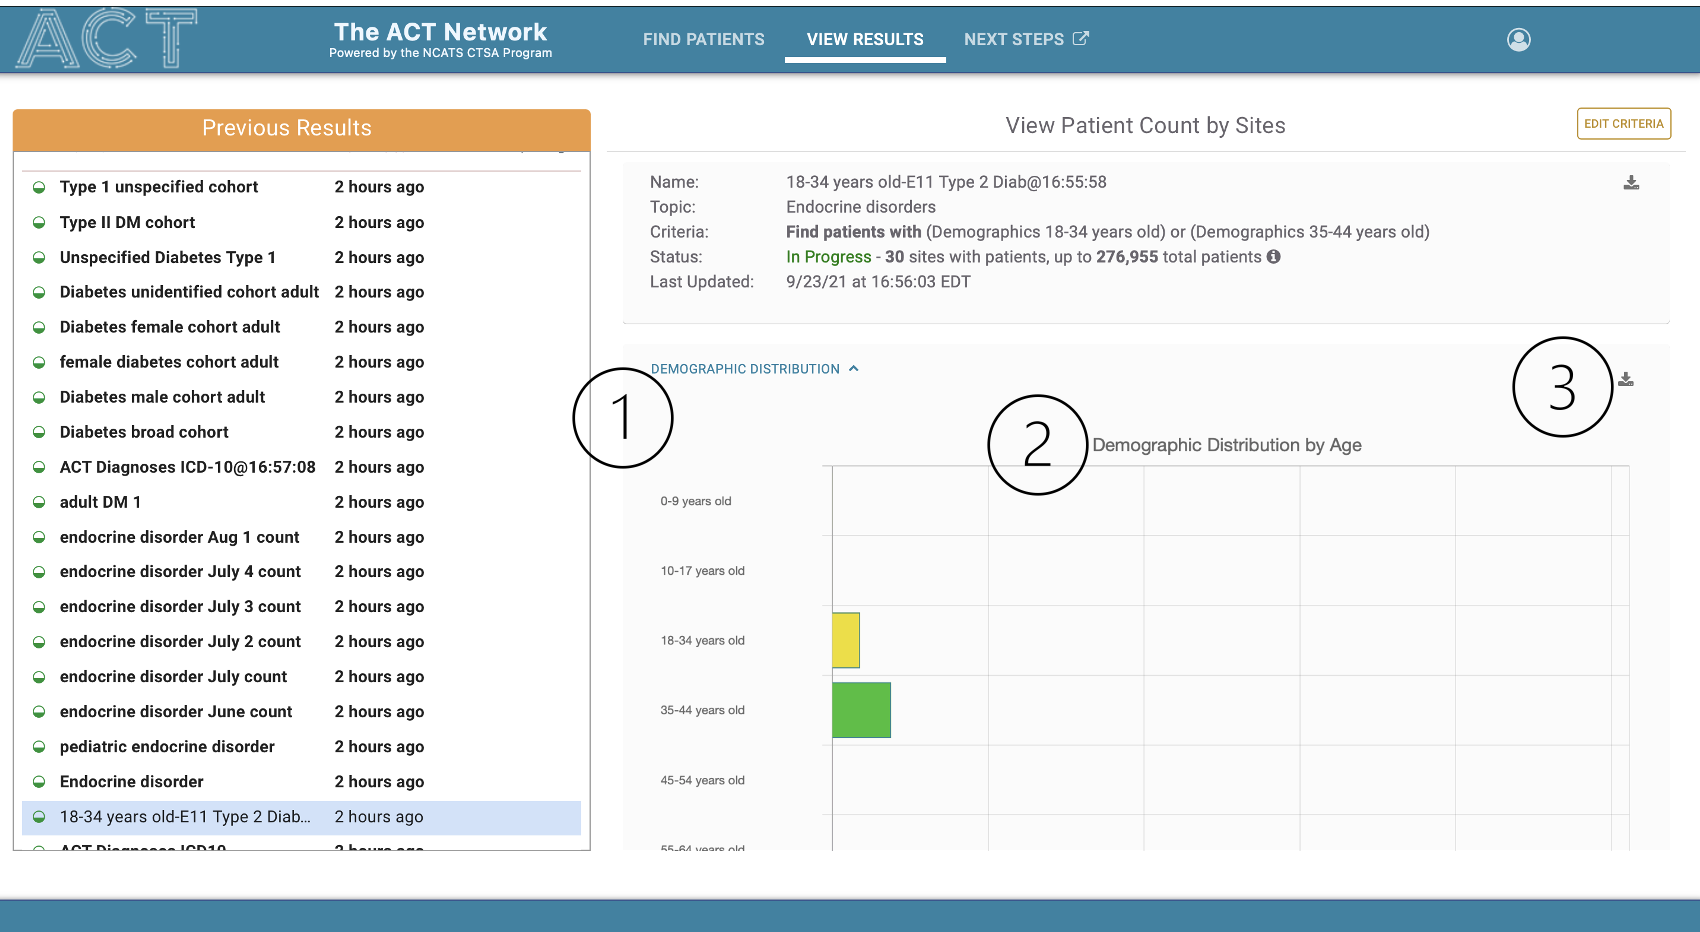
The Demographic Distributions section (1) are a set of 4 graphs that display the patient cohort by dimensions of age, race, sex, and vital status (2). A researcher can download the full set of results per site in a CSV format (3).

Query Name Column
The second column is the query name:

Execution Time
The third column is the time when the query was run:

Flag Query Button
The fourth column is a button that allows the user to flag a query:

Clicking the button reveals the Flagging dialog shown below:
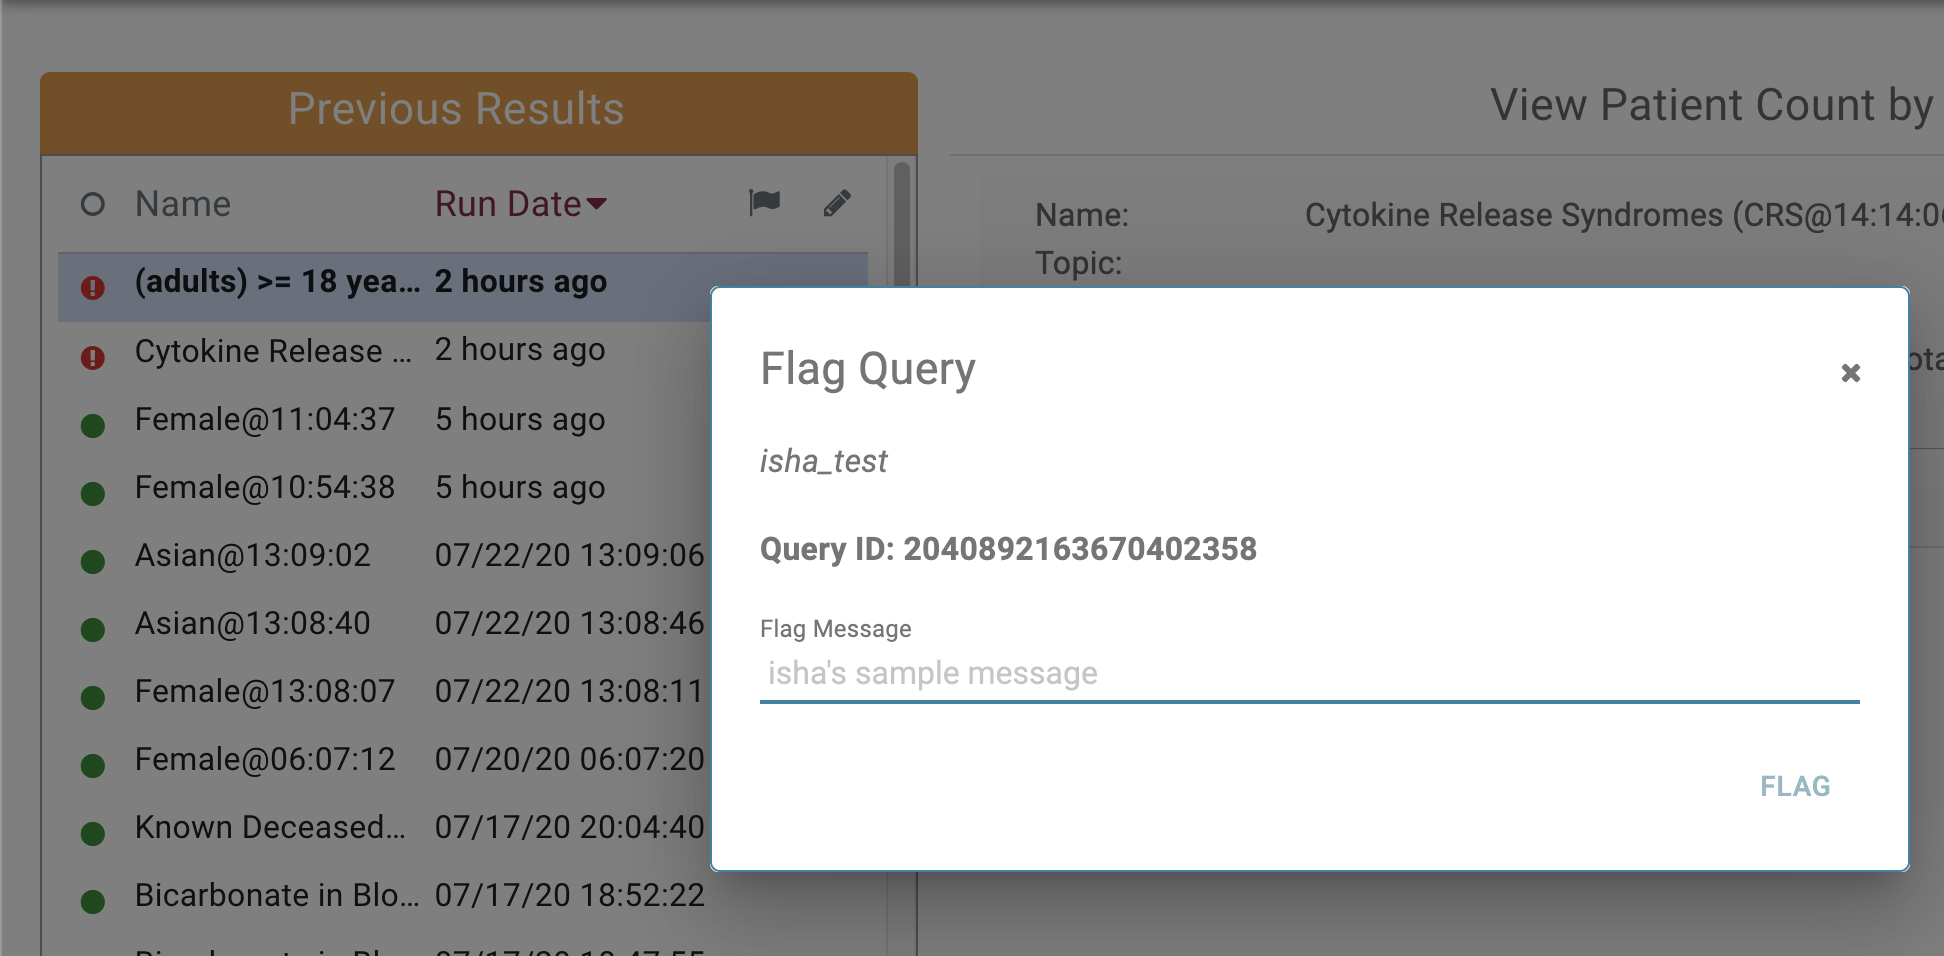
Filling in a flag Message and clicking the flag button will flag the query. A flagged query is indicated by a blue flag icon in the flagging column:

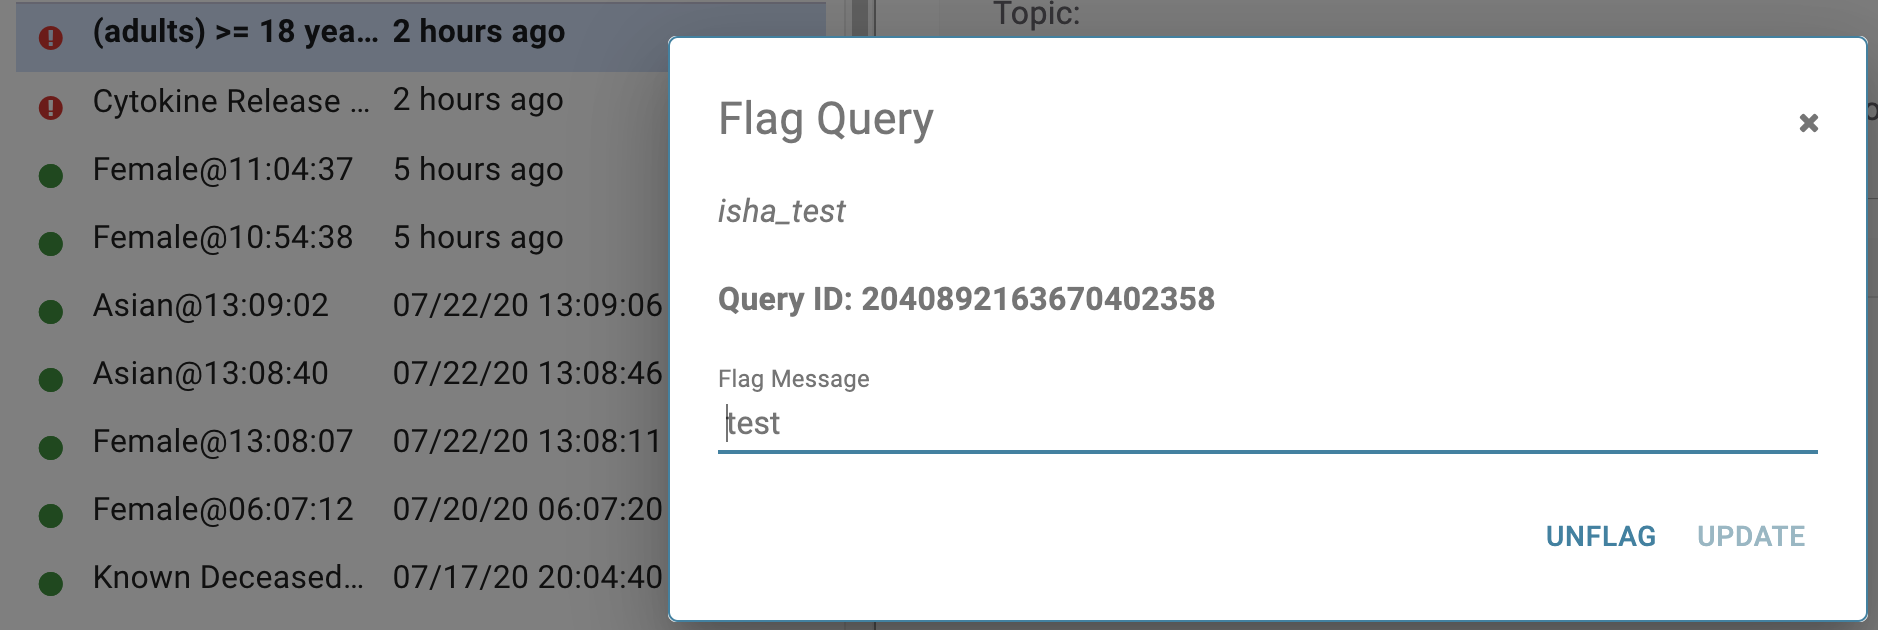
Conversely, the user can unflag the query by clicking the blue flag icon which will launch the unflag dialog. Clicking the unflag button will unflag the query:
Rename Query Button
The fifth column is a button that allows the user to rename a query:

Clicking the rename query button will launch the rename dialog show below:
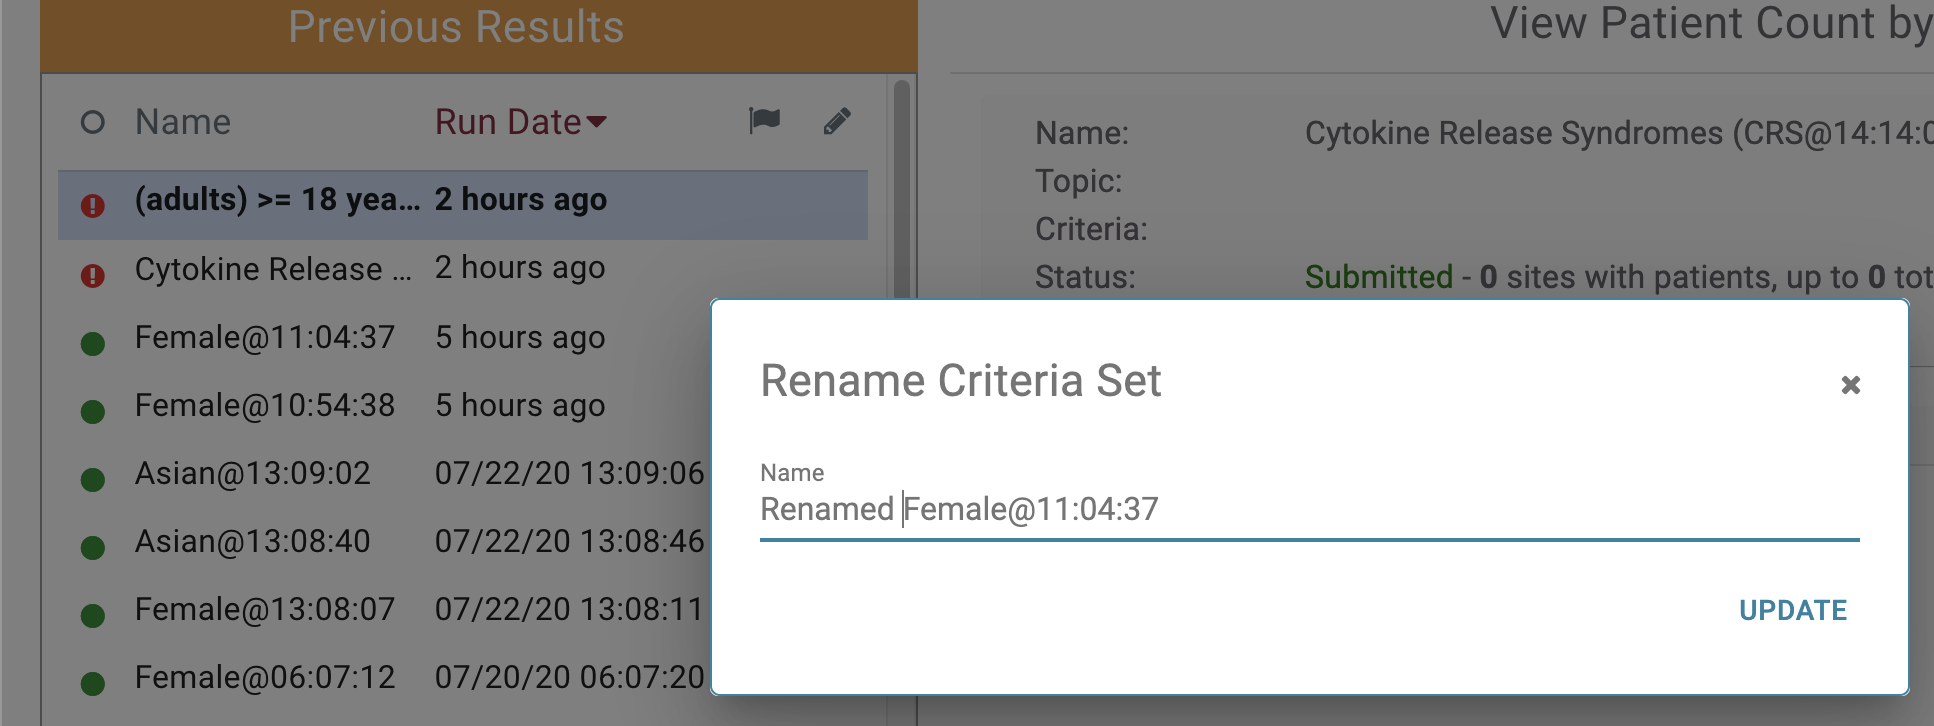
In this example we are changing the name of this query to "Renamed Female@11:04:37" and clicking the update button. The name is now updated in the table row:

2. Patient Counts Module
The Patient Counts Module consists of:
a. Query Metadata
b. Patient Counts
c. Edit Criteria Button.
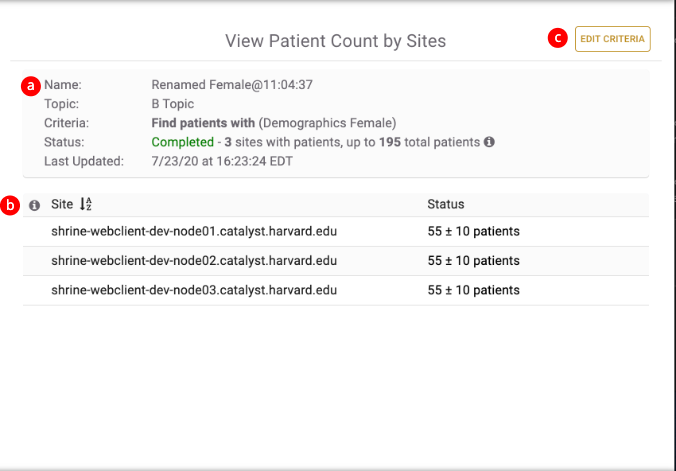
a. Query Metadata
The Query Metadata has the following information rows:
Name - the name of the query.
Topic - the topic that the query is associated with.
Criteria - the query definition
Status - the status of the query...i.e. Completed, Submitted...e.t.c.
Last Updated - a timestamp for the last time the query retrieved updated information.

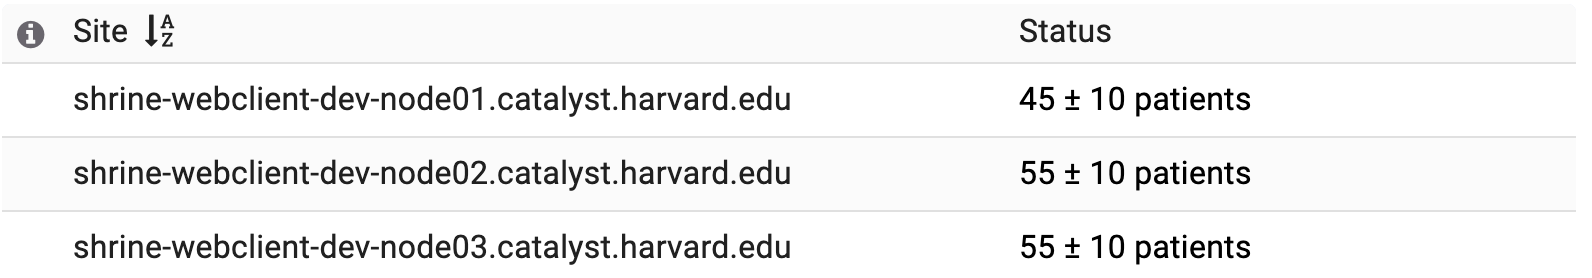
b. Patient Counts
The patient counts table contains rows that display a site name and its associated patient count. In the example below we can see in first row that the site shrine-webclient-dev-node1.catalyst.harvard.edu has a count of 45 patients (plus or minus 10 patients), the site shrine-webclient-dev-node2.catalyst.harvard.edu has a count of 55 patients (plus or minus 10 patients), and the site shrine-webclient-dev-node3.catalyst.harvard.edu has a count of 55 patients (plus or minus 10 patients).
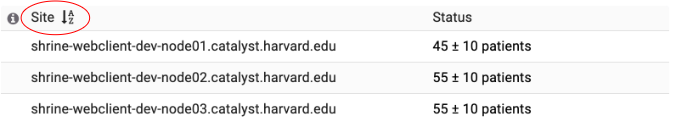
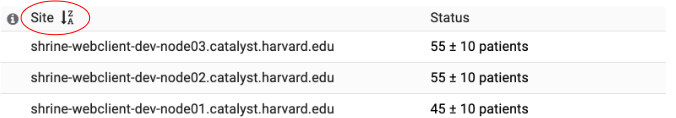
In addition we can sort the results by clicking the Site column header. In the example below, the counts are sorted by site name alphabetically:
In the example below, the counts are sorted by site name reverse-alphabetically:
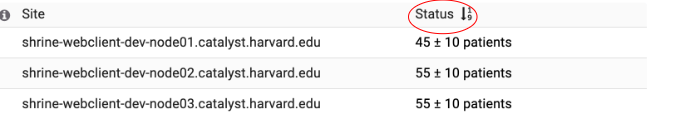
Additionally, we can sort by the status. In the example below the counts are sorted by the number of results ascending with the fewest counts at the top:
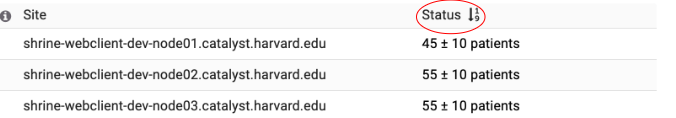
In the example below the counts are sorted by number of results descending with the largest counts at the top:
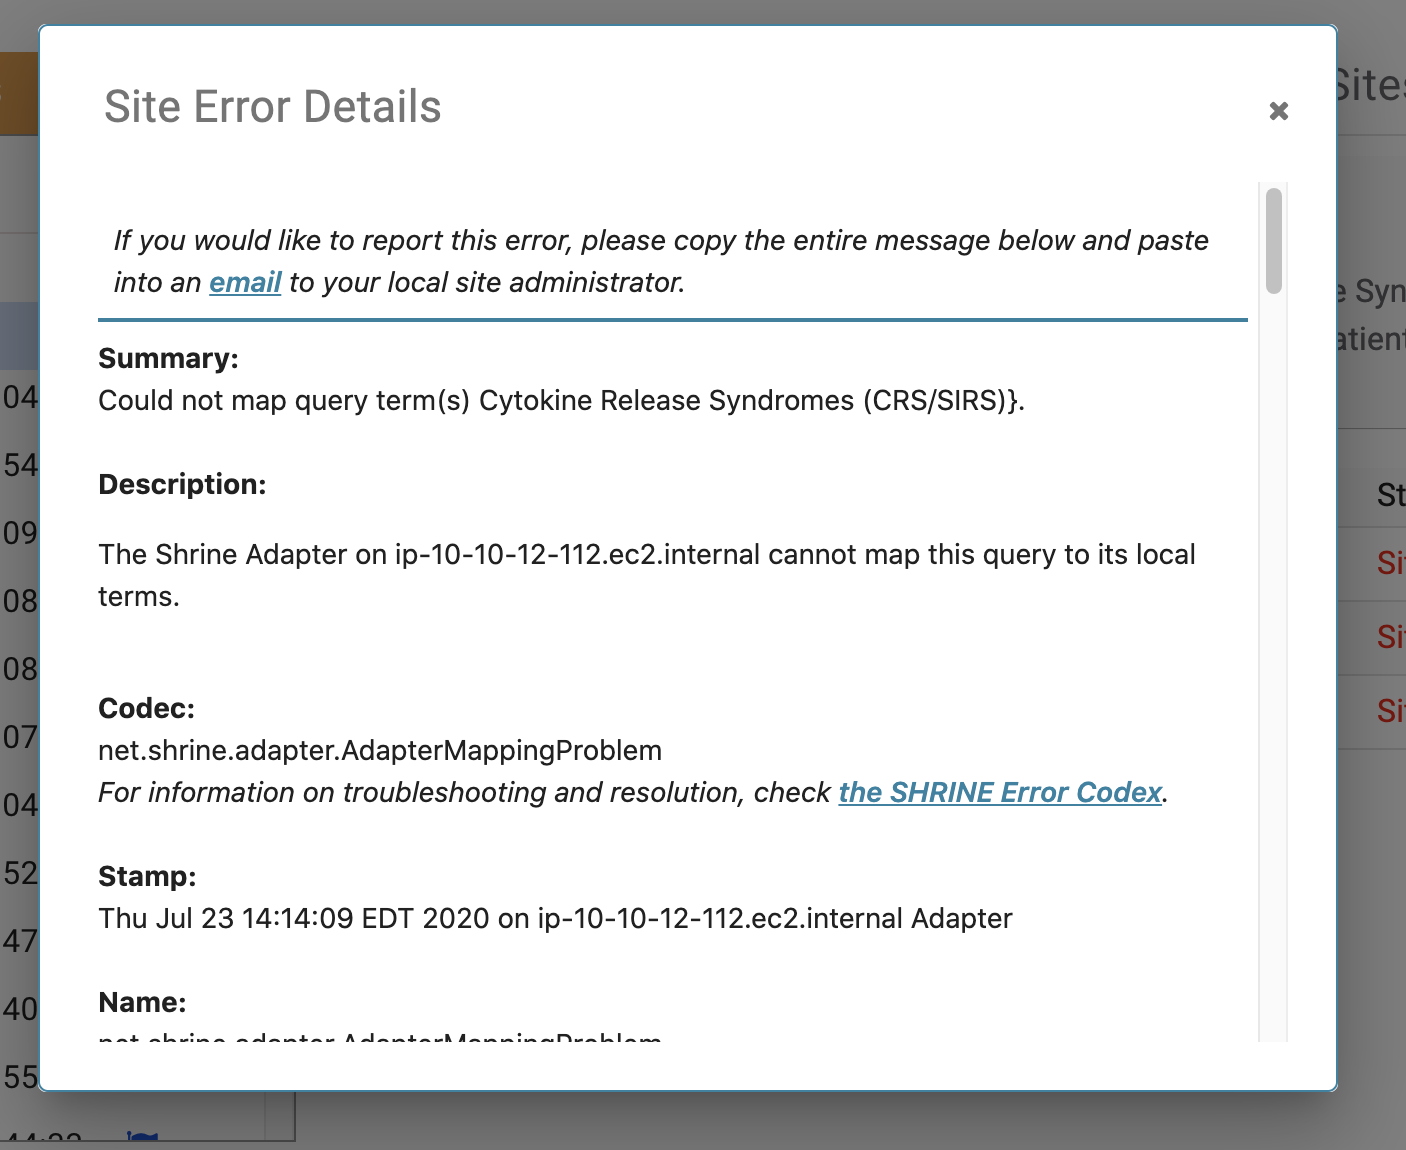
When a query is in process or when it contains errors at one or more sites, the status column will display the status at the sites instead of patient counts. In the example below all the sites in the network are returning an error.
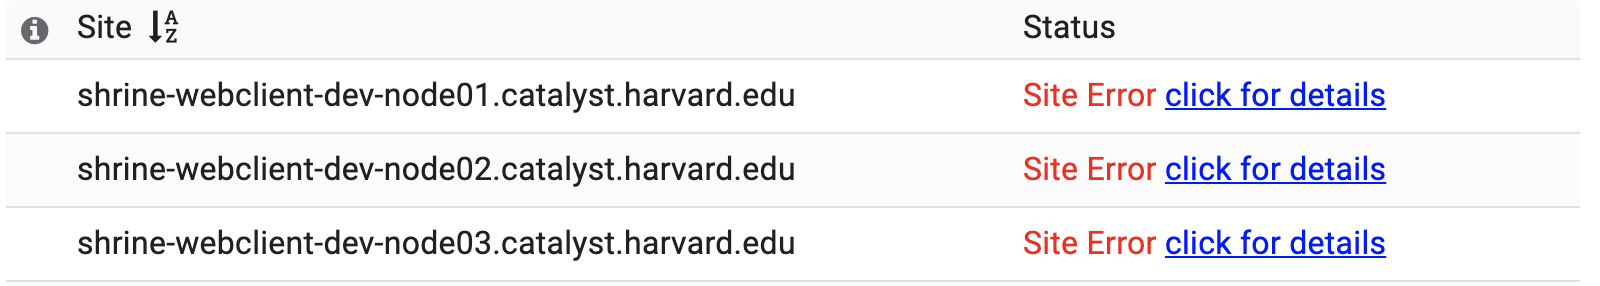
The user can click on one of the "click for details" links to get a more detailed description of the issue:
c. Edit Criteria Button
Clicking the Edit criteria will reconstruct the query and display it's definition in the find patients view.

The result of clicking the Edit Criteria button in our example is shown below. The user can now edit and re-run the query.
...
Overview
Content Tools