Page History
...
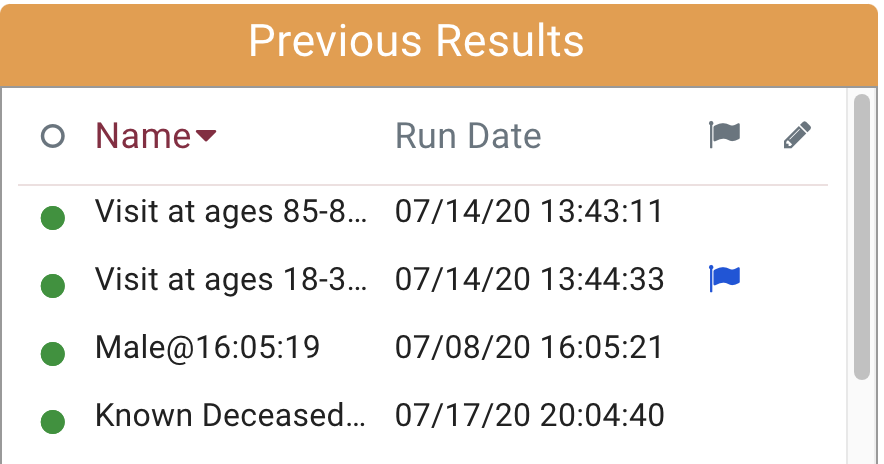
In the following example the results are sorted in reverse alphabetical order:
b. Previous Results
The previous results are queries that are either currently in progress or have already completed.
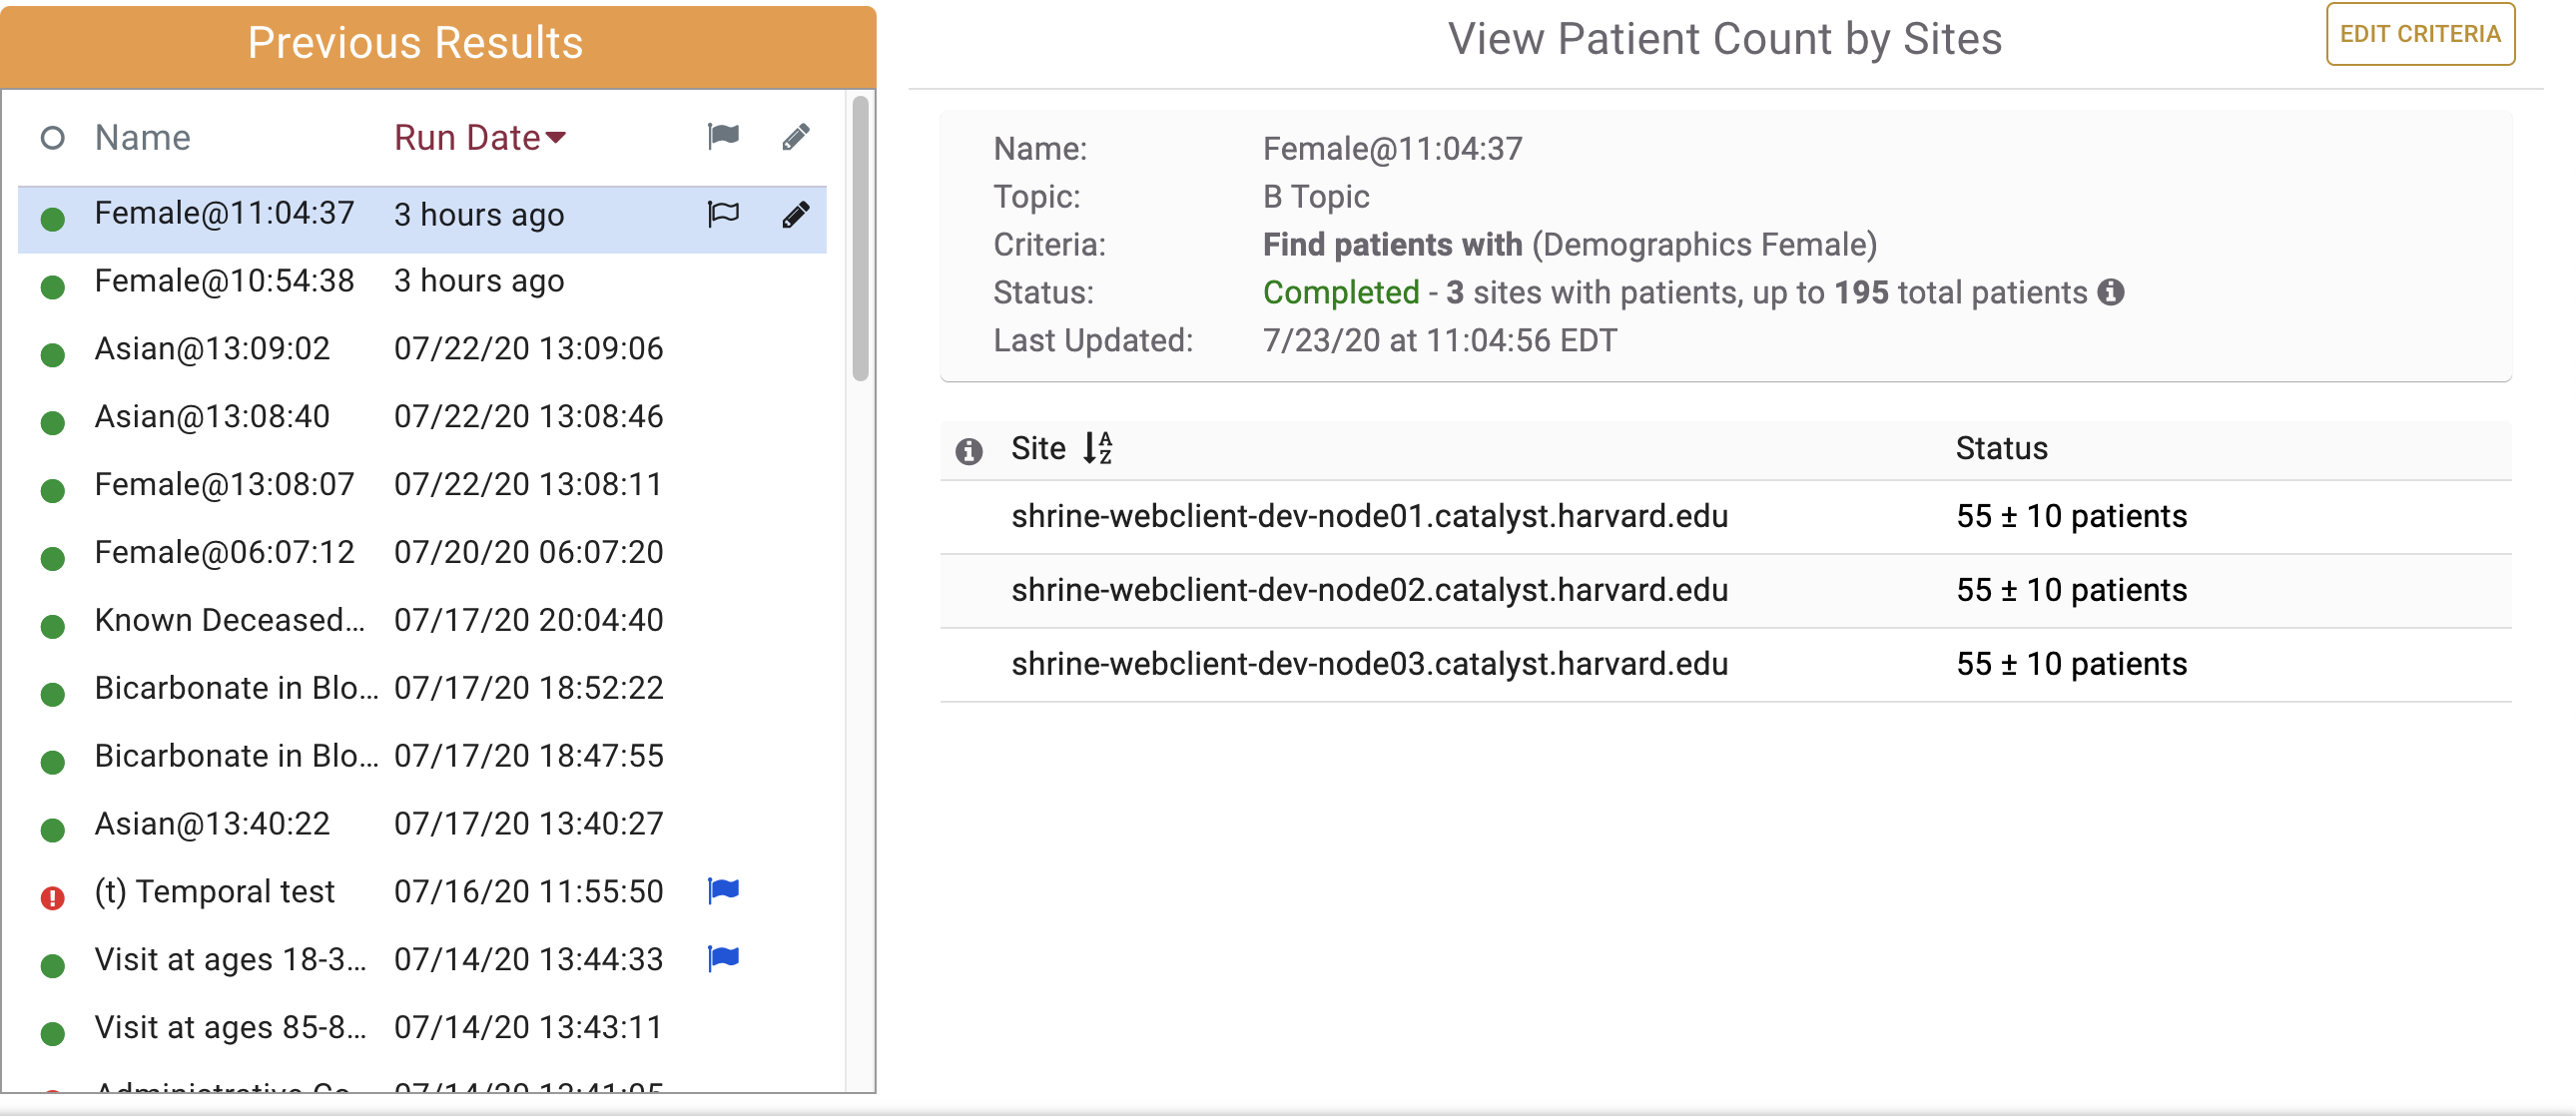
Clicking on one of the queries will retrieve its results as seen below. The right hand section titled View Patient Count By Sites will be described in more detail later on in this tutorial.
Query Status Indicator Column
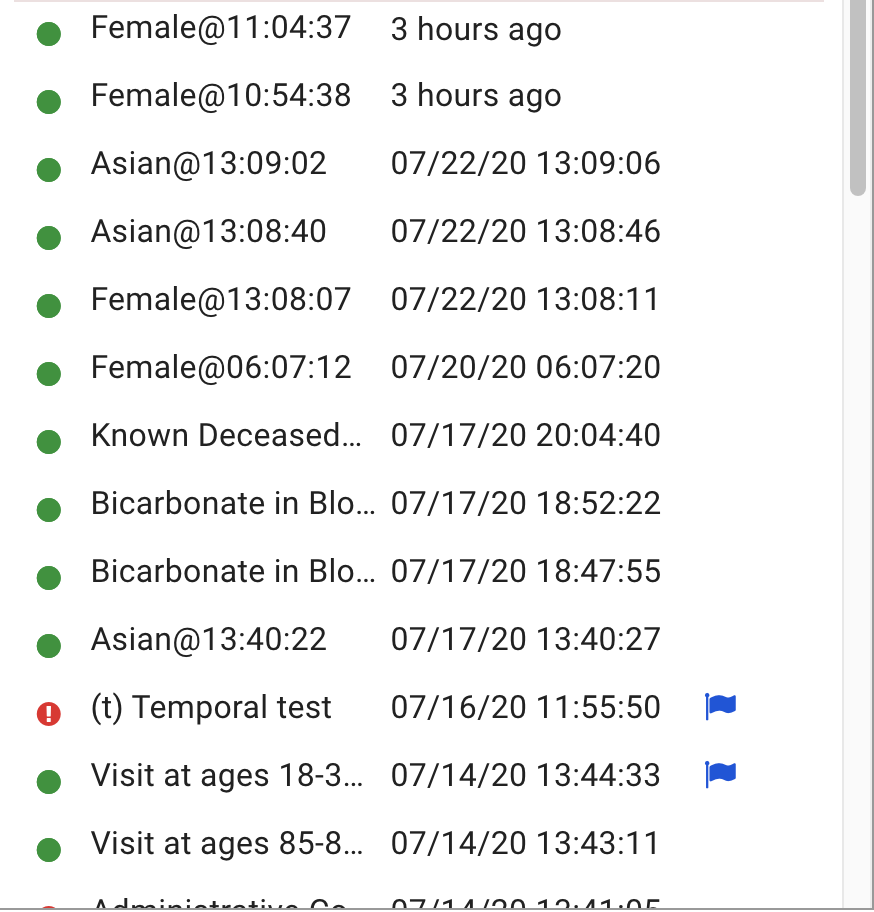
The dot in the first column indicates the status of the query. Green indicates a successfully completed query and Red indicates a query that had an error retrieving results.

Query Name Column
The second column is the query name:

Execution Time
The third column is the time when the query was run:

Flag Query Button
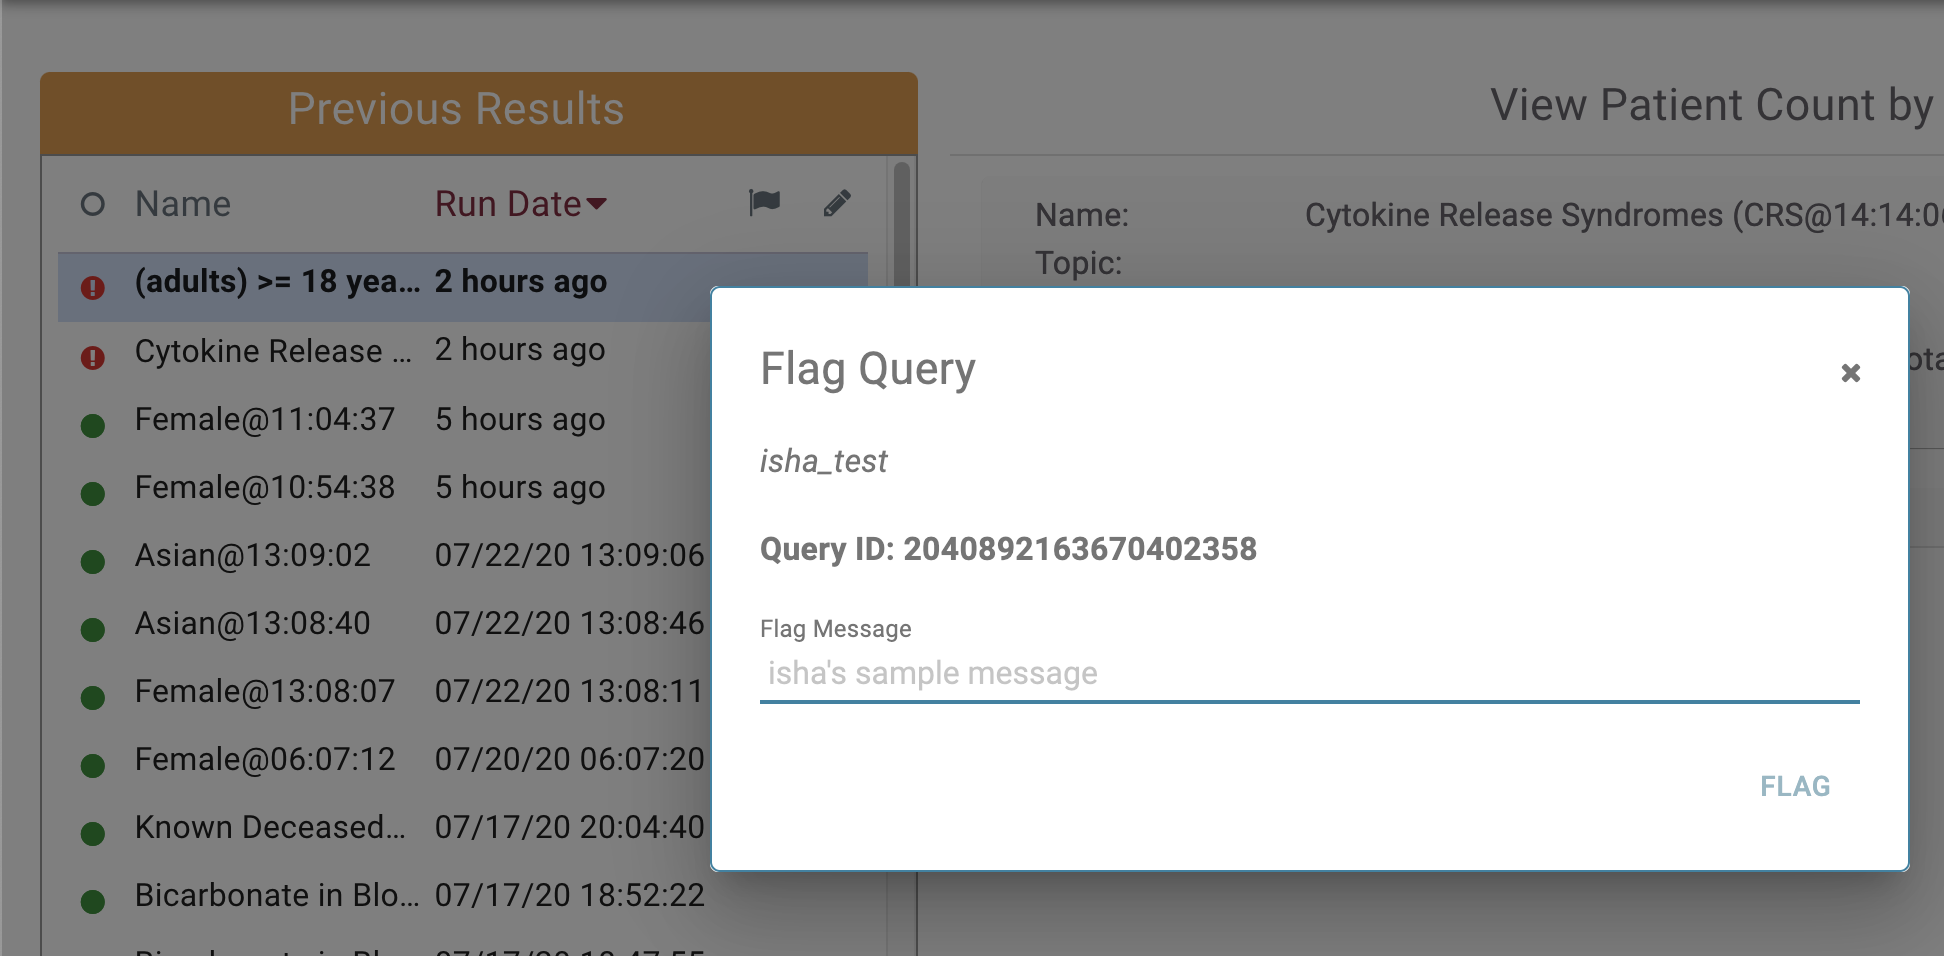
The fourth column is a button that allows the user to flag a query:

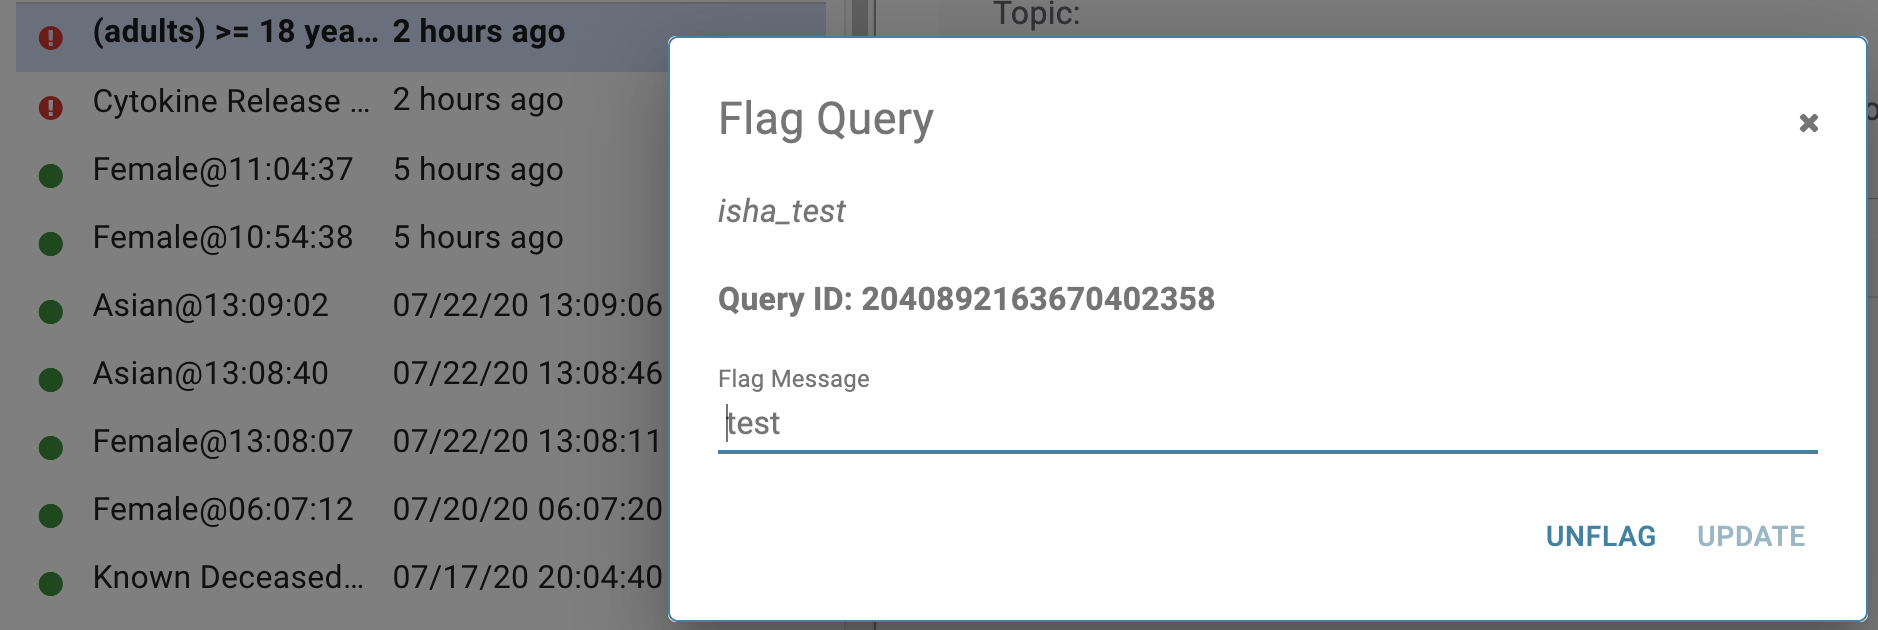
Clicking the button reveals the Flagging dialog shown below:
Filling in a flag Message and clicking the flag button will flag the query. A flagged query is indicated by a blue flag icon in the flagging column:

Conversely, the user can unflag the query by clicking the blue flag icon which will launch the unflag dialog. Clicking the unflag button will unflag the query:
Rename Query Button
The fifth column is a button that allows the user to rename a query:

Clicking the rename query button will launch the rename dialog show below:
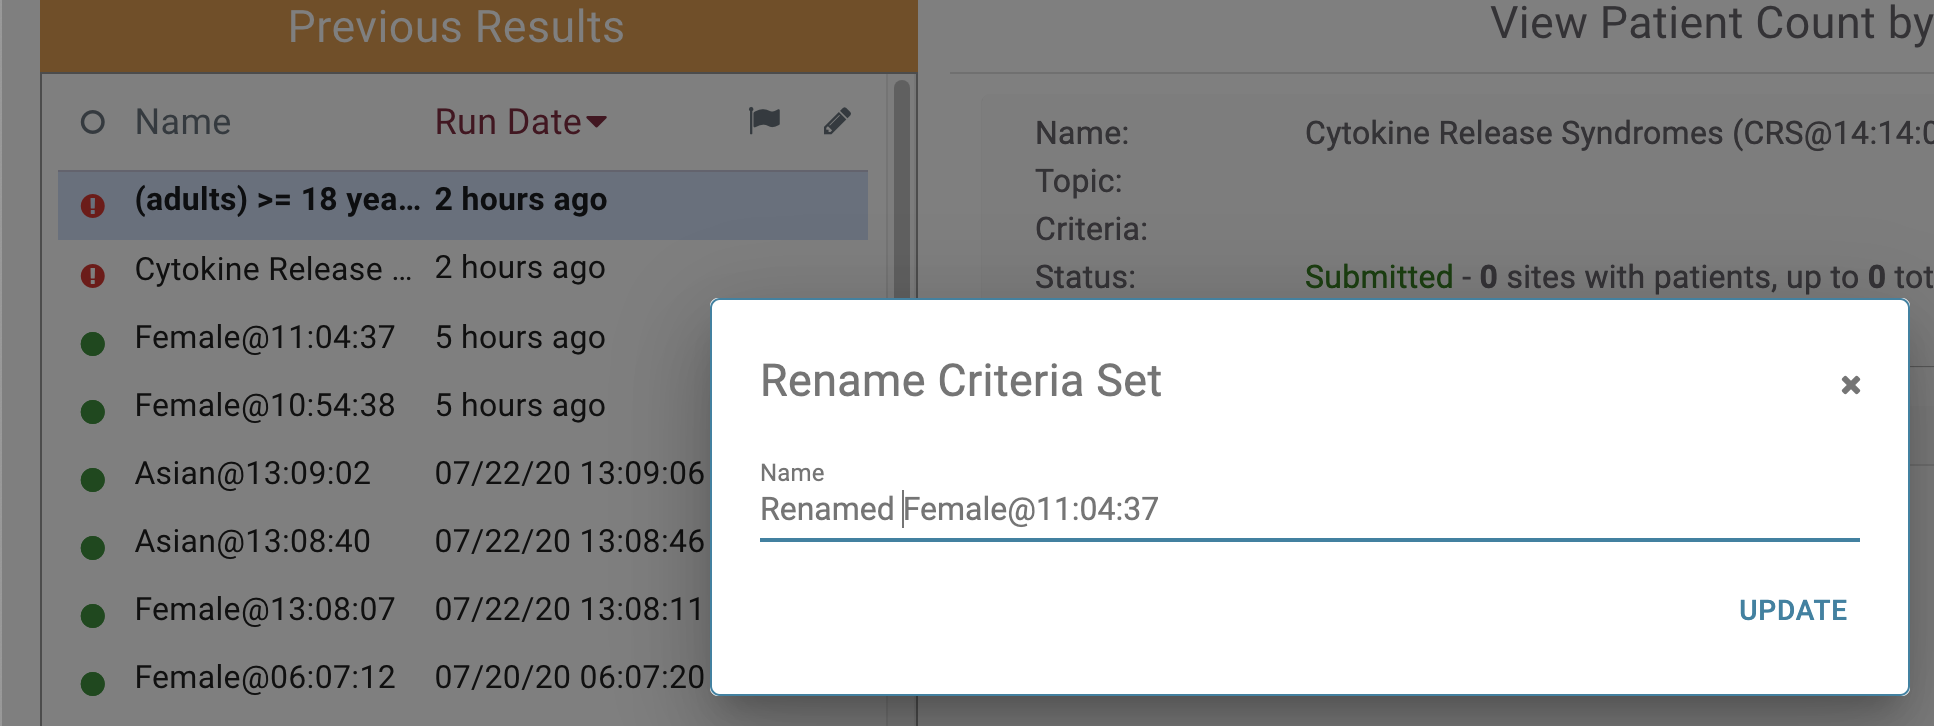
In this example we are changing the name of this query to "Renamed Female@11:04:37" and clicking the update button. The name is now updated in the table row:

2. Patient Counts Module
The Patient Counts Module consists of:
a. Query Metadata
b. Patient Counts
c. Edit Criteria Button.
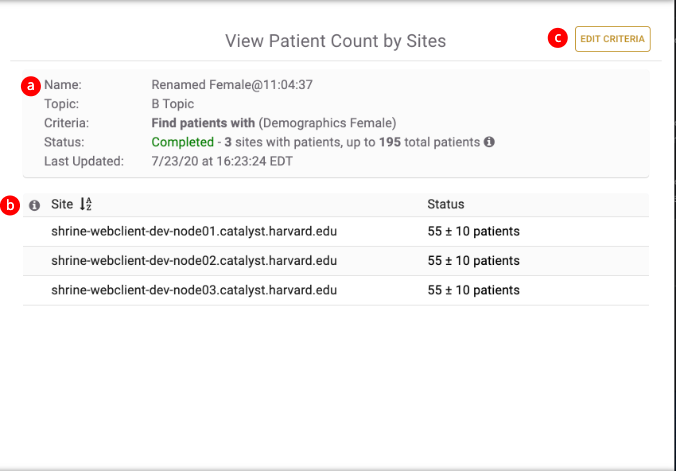
a. Query Metadata
The Query Metadata has the following information rows:
Name - the name of the query.
Topic - the topic that the query is associated with.
Criteria - the query definition
Status - the status of the query...i.e. Completed, Submitted...e.t.c.
Last Updated - a timestamp for the last time the query retrieved updated information.

b. Patient Counts
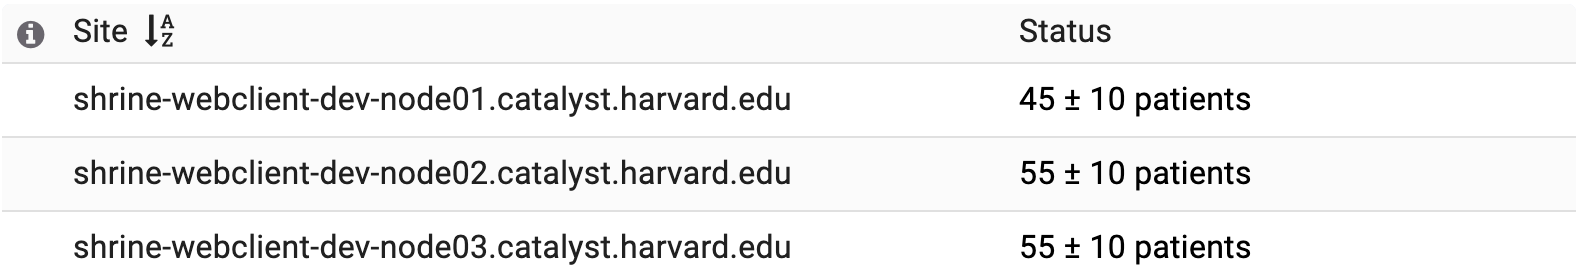
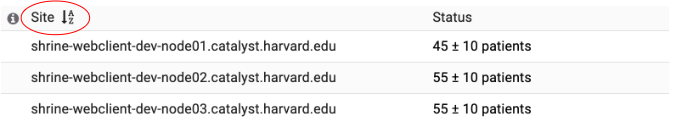
The patient counts table contains rows that display a site name and its associated patient count. In the example below we can see in first row that the site shrine-webclient-dev-node1.catalyst.harvard.edu has a count of 45 patients (plus or minus 10 patients), the site shrine-webclient-dev-node2.catalyst.harvard.edu has a count of 55 patients (plus or minus 10 patients), and the site shrine-webclient-dev-node3.catalyst.harvard.edu has a count of 55 patients (plus or minus 10 patients).
In addition we can sort the results by clicking the Site column header. In the example below, the counts are sorted by site name alphabetically:
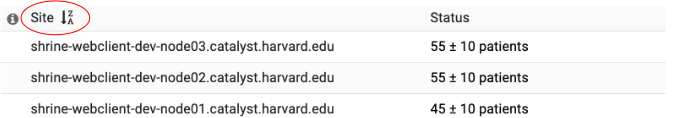
In the example below, the counts are sorted by site name reverse-alphabetically:
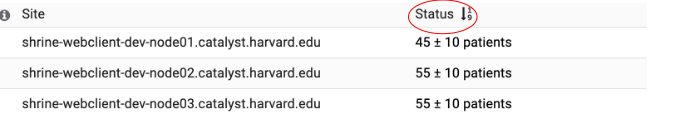
Additionally, we can sort by the status. In the example below the counts are sorted by the number of results ascending with the fewest counts at the top:
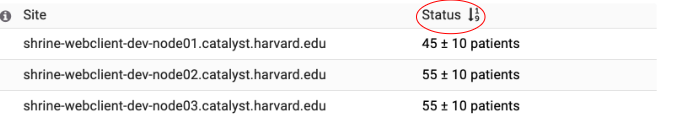
In the example below the counts are sorted by number of results descending with the largest counts at the top:
When a query is in process or when it contains errors at one or more sites, the status column will display the status at the sites instead of patient counts. In the example below all the sites in the network are returning an error.
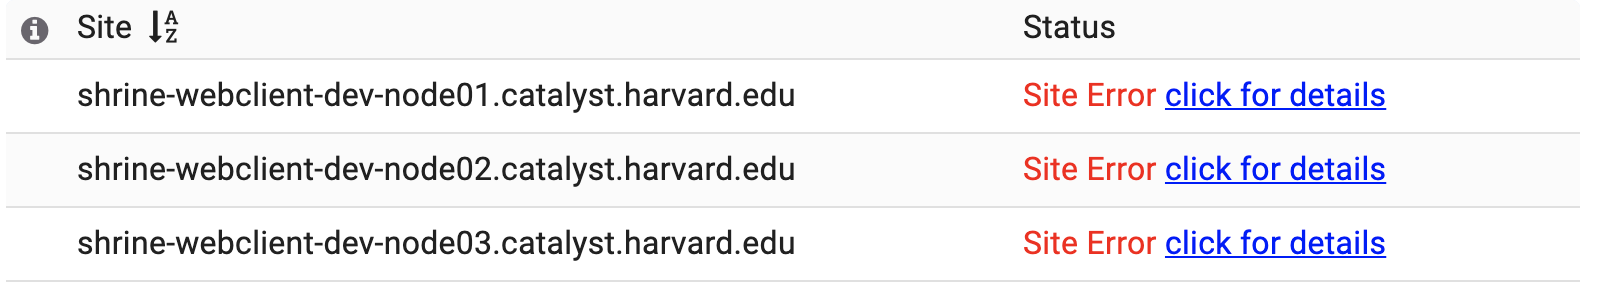
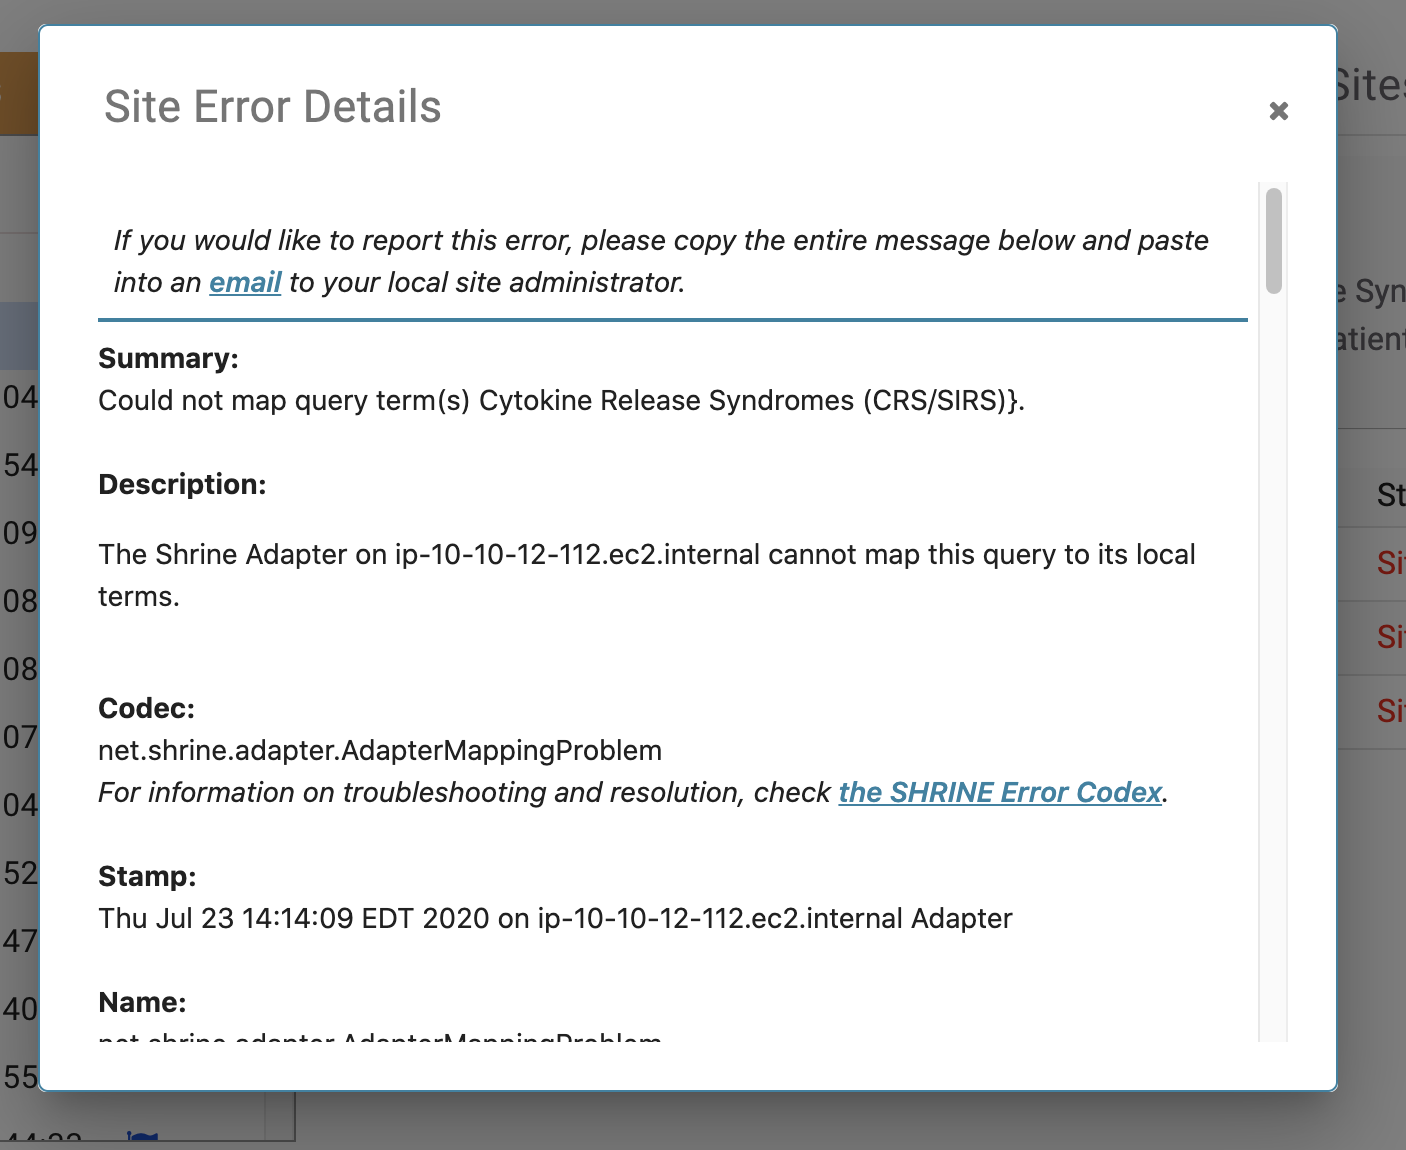
The user can click on one of the "click for details" links to get a more detailed description of the issue:
c. Edit Criteria Button
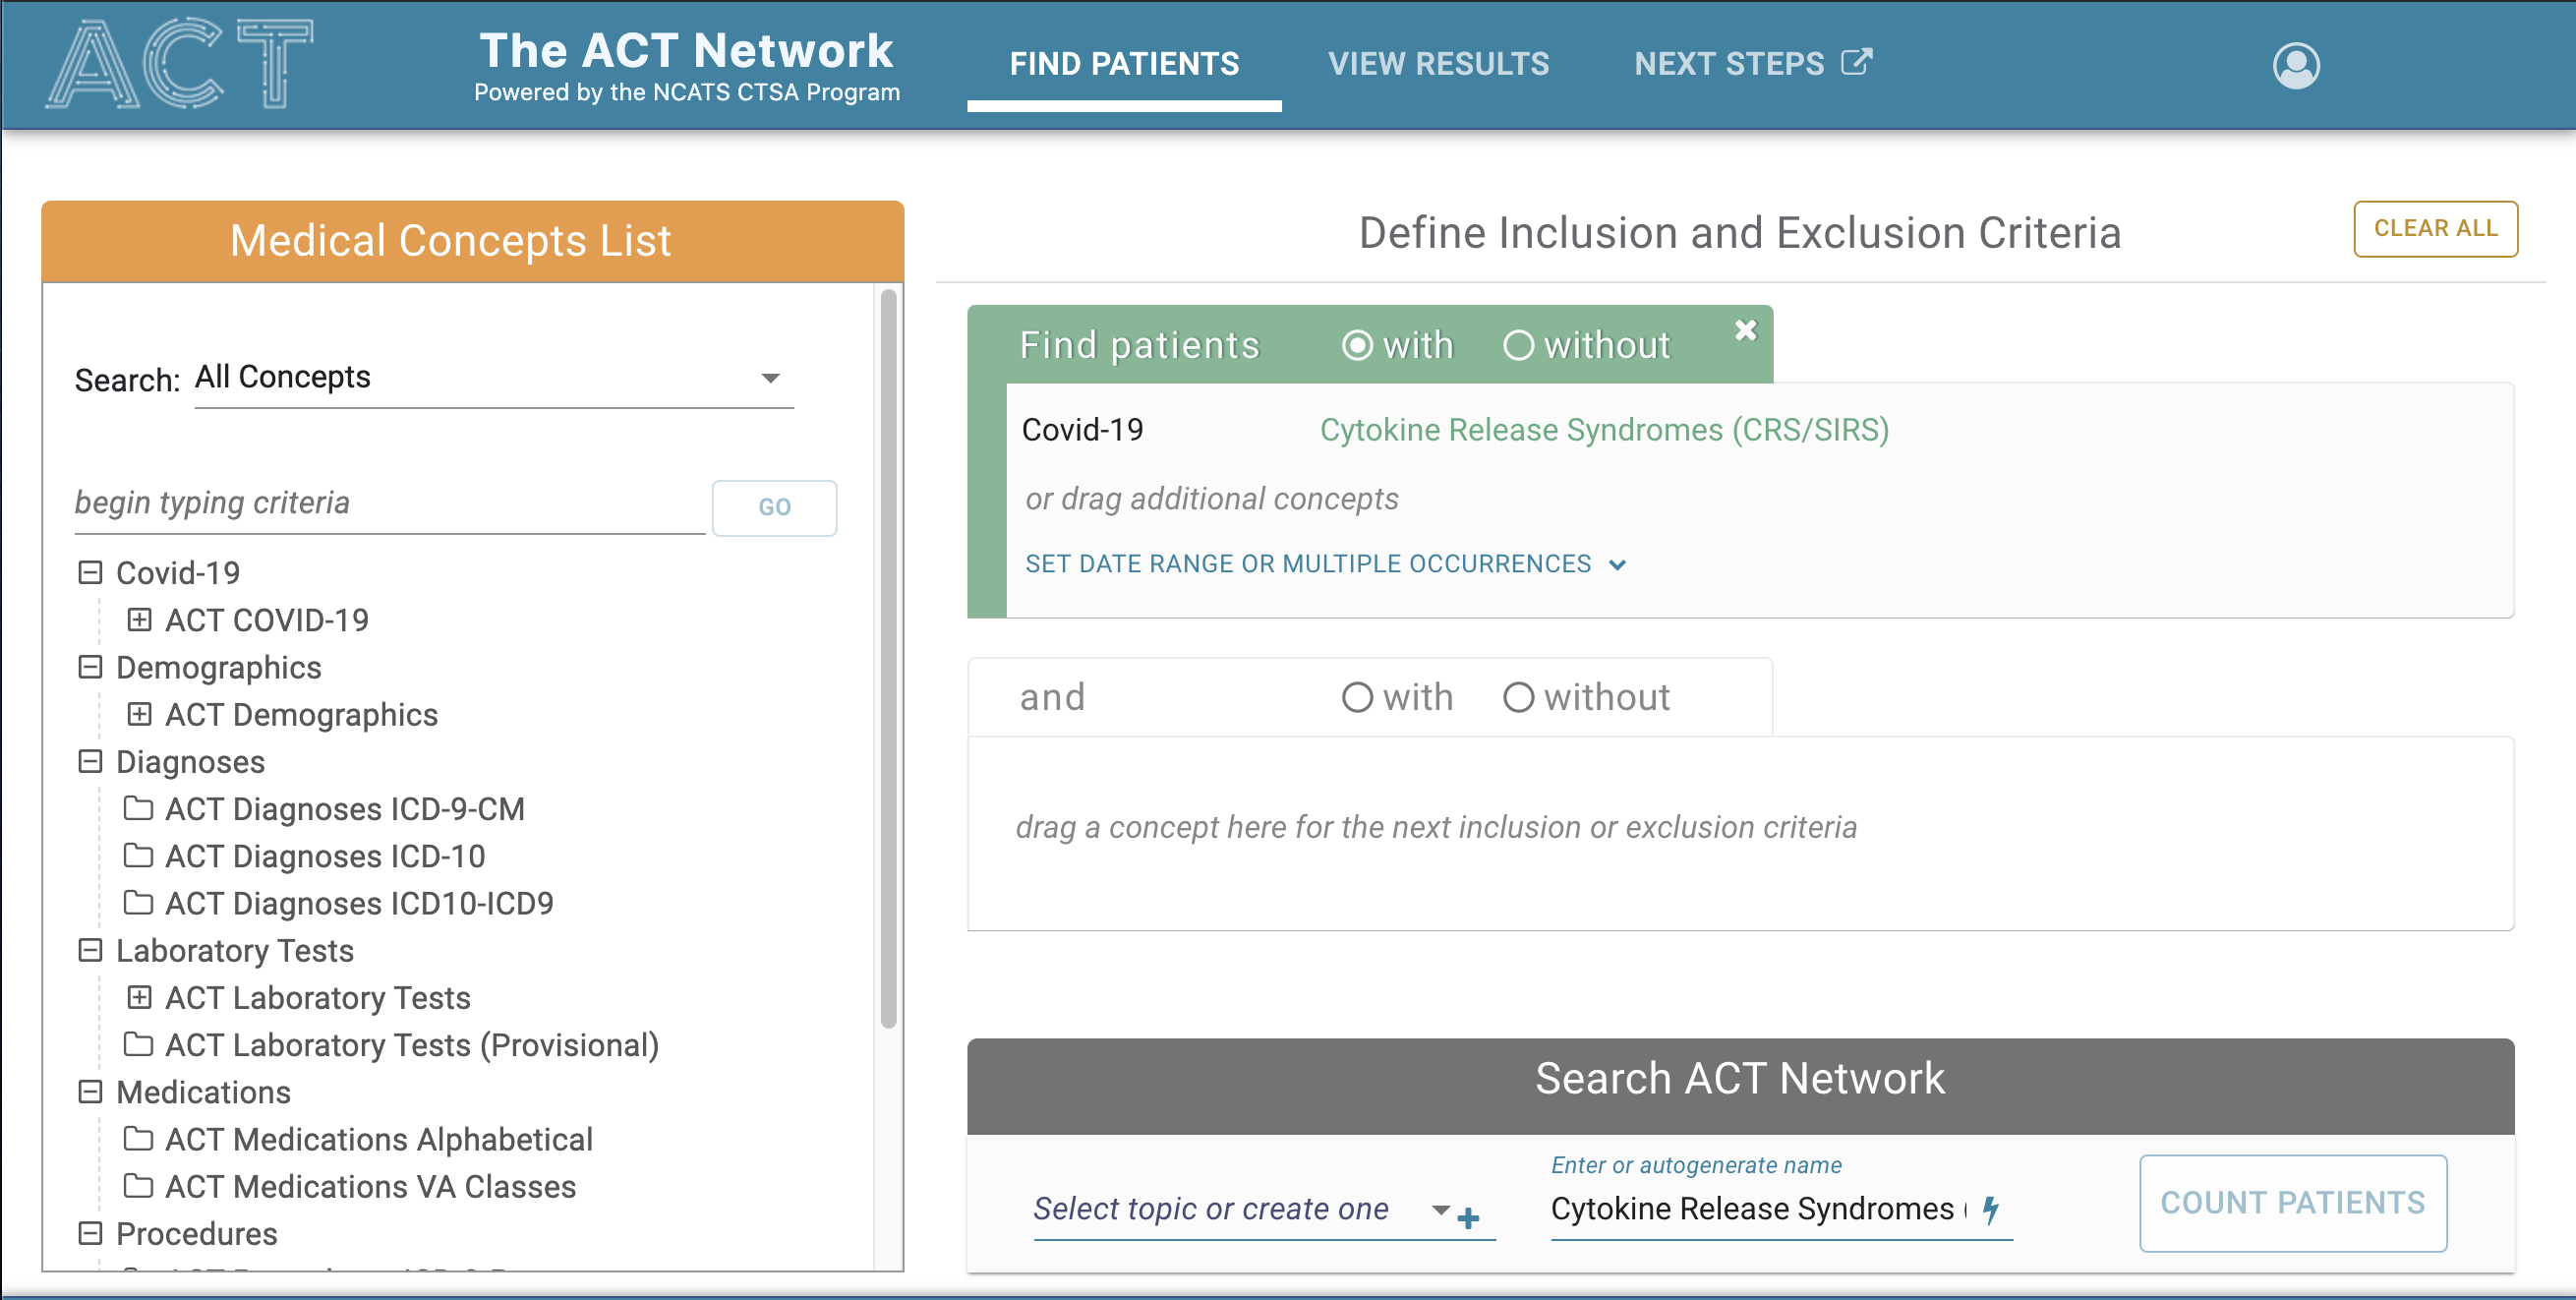
Clicking the Edit criteria will reconstruct the query and display it's definition in the find patients view.

The result of clicking the Edit Criteria button in our example is shown below. The user can now edit and re-run the query.
Overview
Content Tools