Page History
...
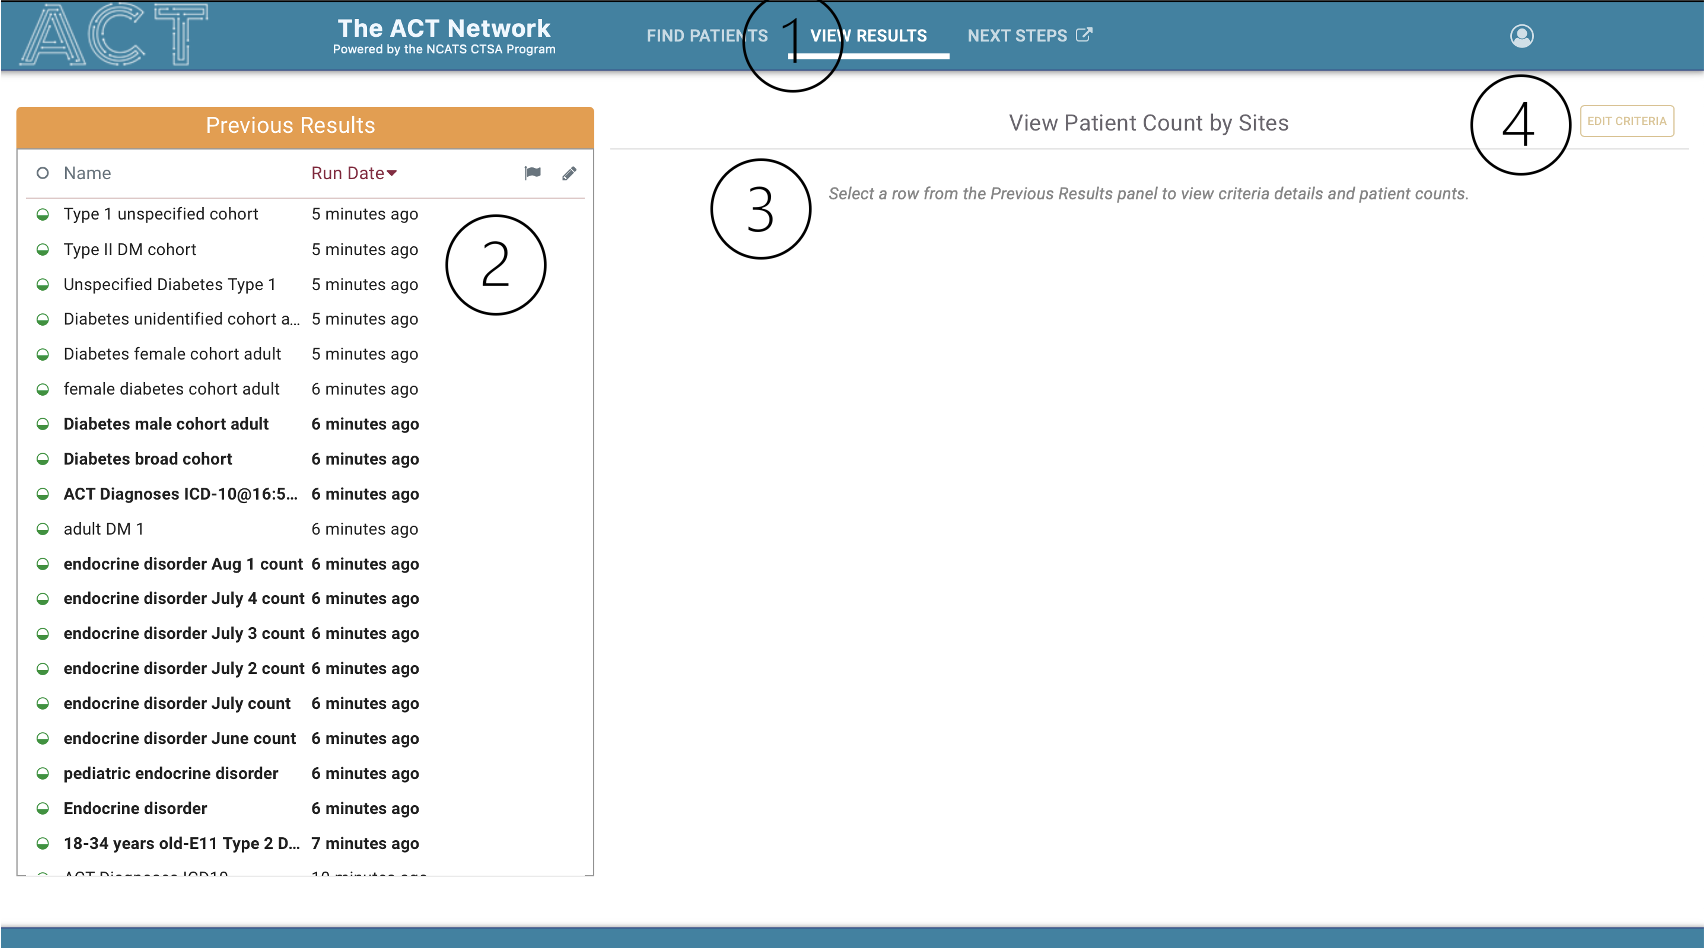
The View Results tab (1) is divided into 2 main panels - The Previous Results panel (2), and the View Patient Counts by Sites (3). The Edit Criteria button seamlessly reloads the entire criteria set back into the Find Patients tab (4).
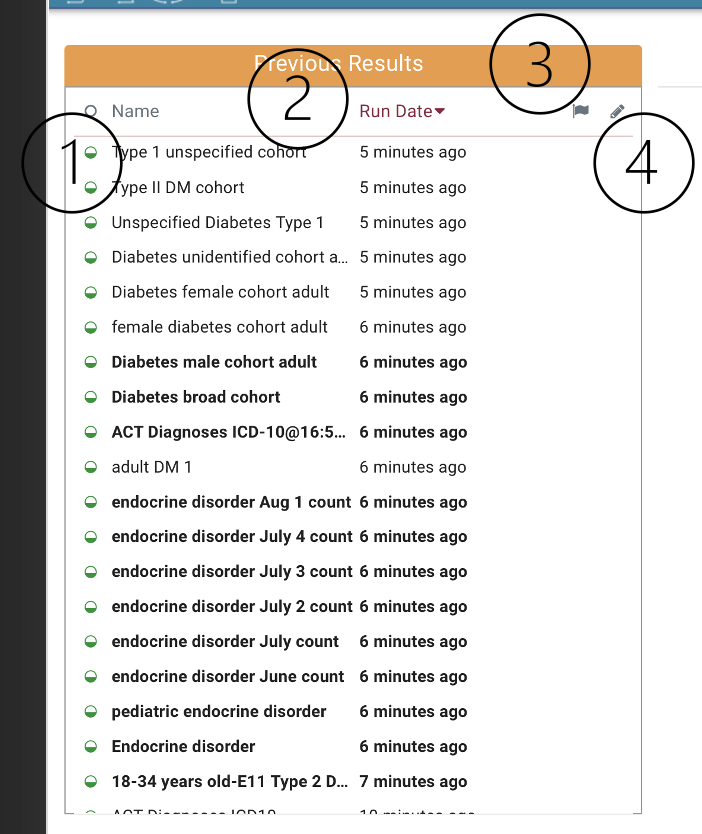
- Previous Results panel. Allows researcher to view the results of patient cohort criteria that are currently in progress or have already completed. Default sorted by recent run date. Each row contains a status indicator (1), name, date/time stamp (2), and the ability to flag a query (3), or edit the name .
...
- (4). Default sorted by recent run date (2).
- Status Indicator
The dot in the first column indicates the status of the query. Green indicates a successfully completed query and Red indicates a query that had an error retrieving results.

Query Name Column
The second column is the query name:

Execution Time
The third column is the time when the query was run:

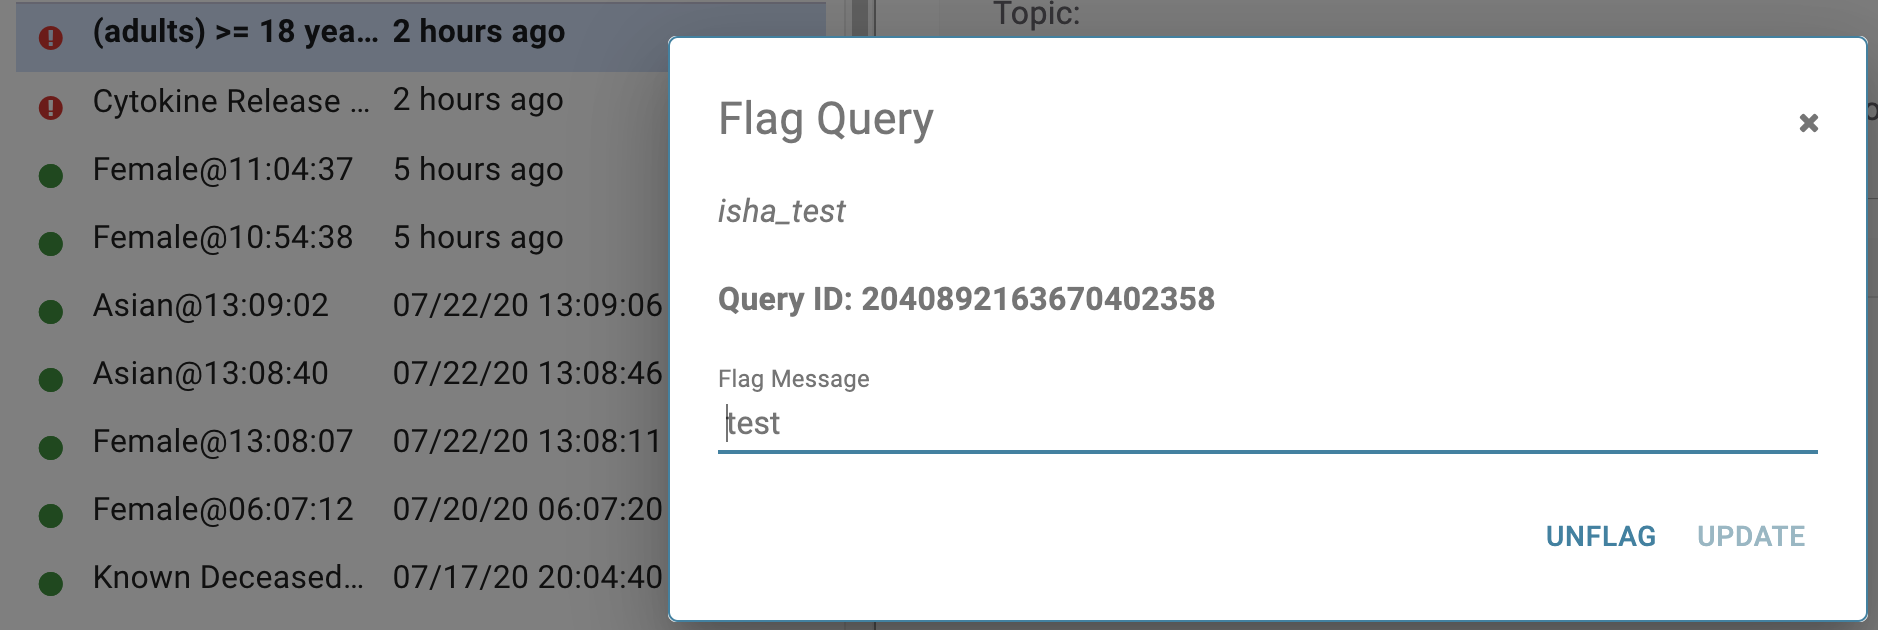
Flag Query Button
The fourth column is a button that allows the user to flag a query:

Clicking on one of the queries will retrieve its results as seen below. The right hand section titled View Patient Count By Sites will be described in more detail later on in this tutorial.
...
Conversely, the user can unflag the query by clicking the blue flag icon which will launch the unflag dialog. Clicking the unflag button will unflag the query:
...
The fifth column is a button that allows the user to rename a query:

Clicking the rename query button will launch the rename dialog show below: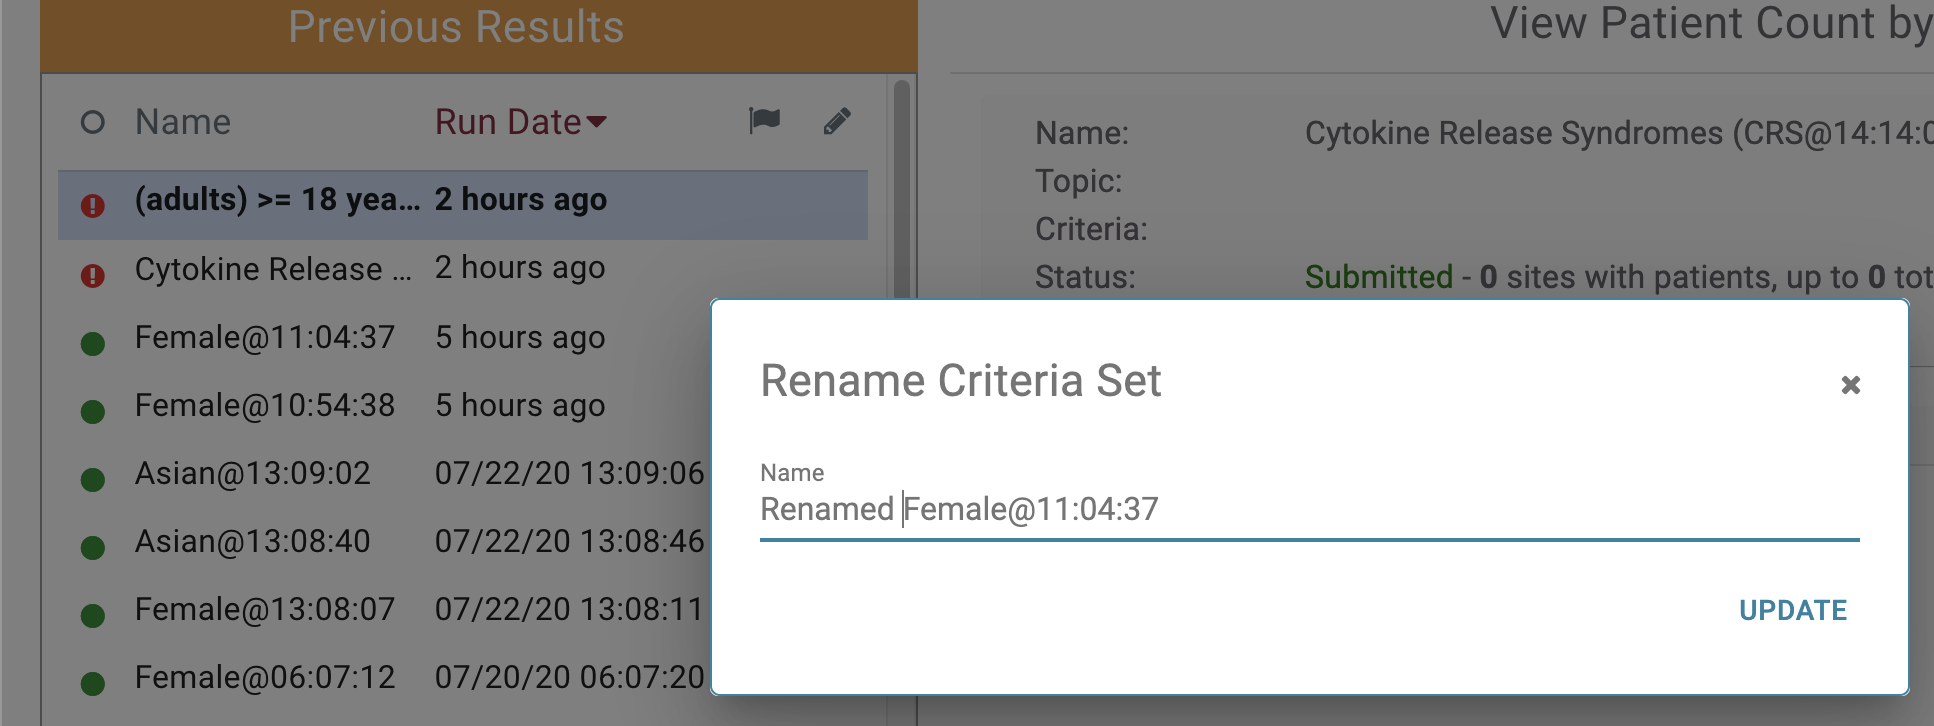
In this example we are changing the name of this query to "Renamed Female@11:04:37" and clicking the update button. The name is now updated in the table row:
Patient Counts Module
...
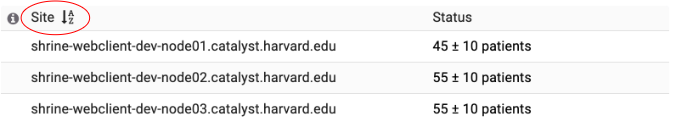
In addition we can sort the results by clicking the Site column header. In the example below, the counts are sorted by site name alphabetically:
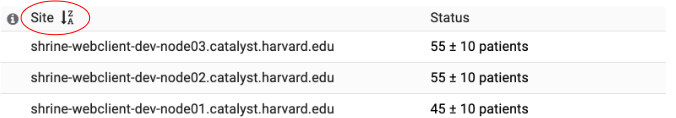
In the example below, the counts are sorted by site name reverse- alphabetically:
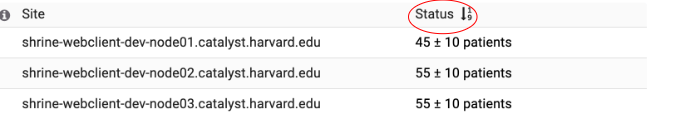
Additionally, we can sort by the status. In the example below the counts are sorted by the number of results ascending with the fewest counts at the top:
In the example below the counts are sorted by number of results descending with the largest counts at the top: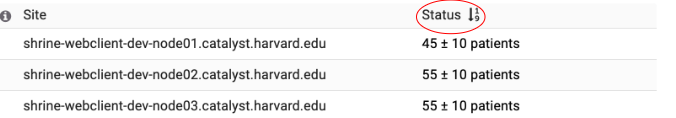
When a query is in process or when it contains errors at one or more sites, the status column will display the status at the sites instead of patient counts. In the example below all the sites in the network are returning an error.
...
Overview
Content Tools